Ok, new error time ![]()
Trying to do Lab 2_1A - Introduction to Power Differences (MAIN), the “Empty” Trace section. Getting the following error when trying to run the cw.plot(wave) line, I’ve rebuilt the firmware and uploaded it to the target (Husky & CW308_SAM4S), all the previous blocks have worked from what I can tell.
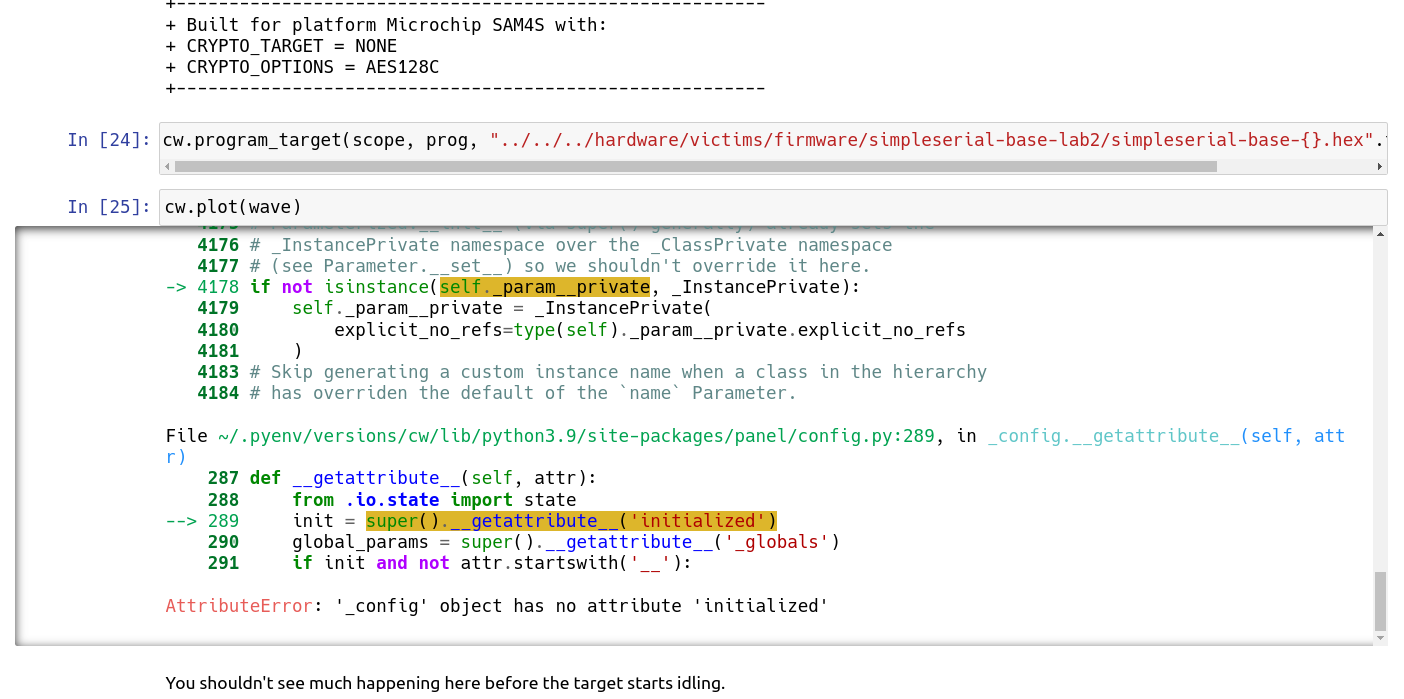
The error itself:
---------------------------------------------------------------------------
AttributeError                            Traceback (most recent call last)
Cell In[25], line 1
----> 1 cw.plot(wave)

File ~/Repos/chipwhisperer/software/chipwhisperer/__init__.py:547, in plot(*args, **kwargs)
    545 if (len(args) == 0) and (len(kwargs) == 0):
    546     args = [[]]
--> 547 import holoviews as hv # type: ignore
    548 _default_opts = {'height': 600, 'width': 800, 'framewise': True, 'tools': ['hover'], 'active_tools': ['box_zoom']}
    549 hv.extension('bokeh', logo=False) #don't display logo, otherwise it pops up everytime this func is called.

File ~/.pyenv/versions/cw/lib/python3.9/site-packages/holoviews/__init__.py:115
    111 warnings.filterwarnings("ignore",
    112                         message="elementwise comparison failed; returning scalar instead")
    114 if "IPython" in sys.modules:
--> 115     from .ipython import notebook_extension
    116     extension = notebook_extension # noqa (name remapping)
    117 else:

File ~/.pyenv/versions/cw/lib/python3.9/site-packages/holoviews/ipython/__init__.py:16
     14 from ..element.comparison import ComparisonTestCase
     15 from ..util import extension
---> 16 from ..plotting.renderer import Renderer
     17 from .magics import load_magics
     18 from .display_hooks import display

File ~/.pyenv/versions/cw/lib/python3.9/site-packages/holoviews/plotting/__init__.py:11
      9 from ..element import Area, Image, QuadMesh, Polygons, Raster
     10 from ..element.sankey import _layout_sankey, Sankey
---> 11 from .plot import Plot
     12 from .renderer import Renderer, HTML_TAGS # noqa (API import)
     13 from .util import apply_nodata, list_cmaps # noqa (API import)

File ~/.pyenv/versions/cw/lib/python3.9/site-packages/holoviews/plotting/plot.py:17
     14 import numpy as np
     15 import param
---> 17 from panel.config import config
     18 from panel.io.document import unlocked
     19 from panel.io.notebook import push

File ~/.pyenv/versions/cw/lib/python3.9/site-packages/panel/__init__.py:47
      1 """Panel is a high level app and dashboarding framework
      2 =======================================================
      3
   (...)
     45 https://panel.holoviz.org/getting_started/index.html
     46 """
---> 47 from . import layout # noqa
     48 from . import links # noqa
     49 from . import pane # noqa

File ~/.pyenv/versions/cw/lib/python3.9/site-packages/panel/layout/__init__.py:1
----> 1 from .accordion import Accordion # noqa
      2 from .base import Column, ListLike, ListPanel, Panel, Row, WidgetBox # noqa
      3 from .card import Card # noqa

File ~/.pyenv/versions/cw/lib/python3.9/site-packages/panel/layout/accordion.py:5
      1 import param
      3 from bokeh.models import Column as BkColumn, CustomJS
----> 5 from .base import NamedListPanel
      6 from .card import Card
      9 class Accordion(NamedListPanel):

File ~/.pyenv/versions/cw/lib/python3.9/site-packages/panel/layout/base.py:13
     11 from ..io.model import hold
     12 from ..io.state import state
---> 13 from ..reactive import Reactive
     14 from ..util import param_name, param_reprs
     16 _row = namedtuple("row", ["children"])

File ~/.pyenv/versions/cw/lib/python3.9/site-packages/panel/reactive.py:33
     29 from .models.reactive_html import (
     30     ReactiveHTML as _BkReactiveHTML, ReactiveHTMLParser
     31 )
     32 from .util import edit_readonly, escape, updating
---> 33 from .viewable import Layoutable, Renderable, Viewable
     35 log = logging.getLogger('panel.reactive')
     37 LinkWatcher = namedtuple("Watcher", Watcher._fields+('target', 'links', 'transformed', 'bidirectional_watcher'))

File ~/.pyenv/versions/cw/lib/python3.9/site-packages/panel/viewable.py:25
     22 from bokeh.io import curdoc as _curdoc
     23 from pyviz_comms import JupyterCommManager
---> 25 from .config import config, panel_extension
     26 from .io import serve
     27 from .io.document import init_doc

File ~/.pyenv/versions/cw/lib/python3.9/site-packages/panel/config.py:417
    414 else:
    415     _params = _config.param.params()
--> 417 config = _config(**{k: None if p.allow_None else getattr(_config, k)
    418                     for k, p in _params.items() if k != 'name'})
    421 class panel_extension(_pyviz_extension):
    422     """
    423     Initializes the pyviz notebook extension to allow plotting with
    424     bokeh and enable comms.
    425     """

File ~/.pyenv/versions/cw/lib/python3.9/site-packages/panel/config.py:216, in _config.__init__(self, **params)
    215 def __init__(self, **params):
--> 216     super().__init__(**params)
    217     self._validating = False
    218     for p in self.param:

File ~/.pyenv/versions/cw/lib/python3.9/site-packages/param/parameterized.py:4178, in Parameterized.__init__(self, **params)
   4172 global object_count
   4174 # Setting a Parameter value in an __init__ block before calling
   4175 # Parameterized.__init__ (via super() generally) already sets the
   4176 # _InstancePrivate namespace over the _ClassPrivate namespace
   4177 # (see Parameter.__set__) so we shouldn't override it here.
-> 4178 if not isinstance(self._param__private, _InstancePrivate):
   4179     self._param__private = _InstancePrivate(
   4180         explicit_no_refs=type(self)._param__private.explicit_no_refs
   4181     )
   4183 # Skip generating a custom instance name when a class in the hierarchy
   4184 # has overriden the default of the `name` Parameter.

File ~/.pyenv/versions/cw/lib/python3.9/site-packages/panel/config.py:289, in _config.__getattribute__(self, attr)
    287 def __getattribute__(self, attr):
    288     from .io.state import state
--> 289     init = super().__getattribute__('initialized')
    290     global_params = super().__getattribute__('_globals')
    291     if init and not attr.startswith('__'):

AttributeError: '_config' object has no attribute 'initialized'
Any help would be brilliant.
UPDATE: Nevermind, this post had the solution, yet another python module that needs to be downgraded.
In another unrelated question, how do you set the colours of the lines in a cw.plot(waveX)? I assumed it was the same as the usual plt.plot(x,y, color='yellow') but that doesn’t seem to work. Neither does the plt.plot(data, 'g') way as shown in the Introduction to Jupyter Notebooks notebook.
Thanks!