I am trying to write a very minimal prove of concept of measuring power consumption on the CWLite ARM board. I have written some basic target source code and some python code to compile it. I am using Simpleserial V2.
Target source code:
// ... includes

uint8_t handle(uint8_t cmd, uint8_t scmd, uint8_t len, uint8_t *buf)
{
  trigger_high();
  /// Cause more clock cycles to happen the higher the scmd is
  for (uint8_t i = 0; i < scmd; i++) {
    // ... Cause a lot of clock cycles to be used.
  }
  trigger_low();

  // For now we can just return the buff back to the user.
  uint8_t buff[1] = {scmd};
  simpleserial_put('r', 1, buff);

  return 0;
}

int main(void) {
  platform_init();
  init_uart();
  trigger_setup();

  simpleserial_init();

  // A handler
  simpleserial_addcmd('p', 16, handle);

  while (1)
    simpleserial_get();
}
The python script to fetch the traces
// ... setup code
data = bytearray([0x42] * 16)
traces = []
for i in [0, 250]:
scope.arm()
target.flush()
target.send_cmd('p', i, data)
ret = scope.capture()
traces.append(scope.get_last_trace())
returned_data = target.read_cmd('r')
print(returned_data)
ack = target.read_cmd('e')
import matplotlib.pyplot as plt
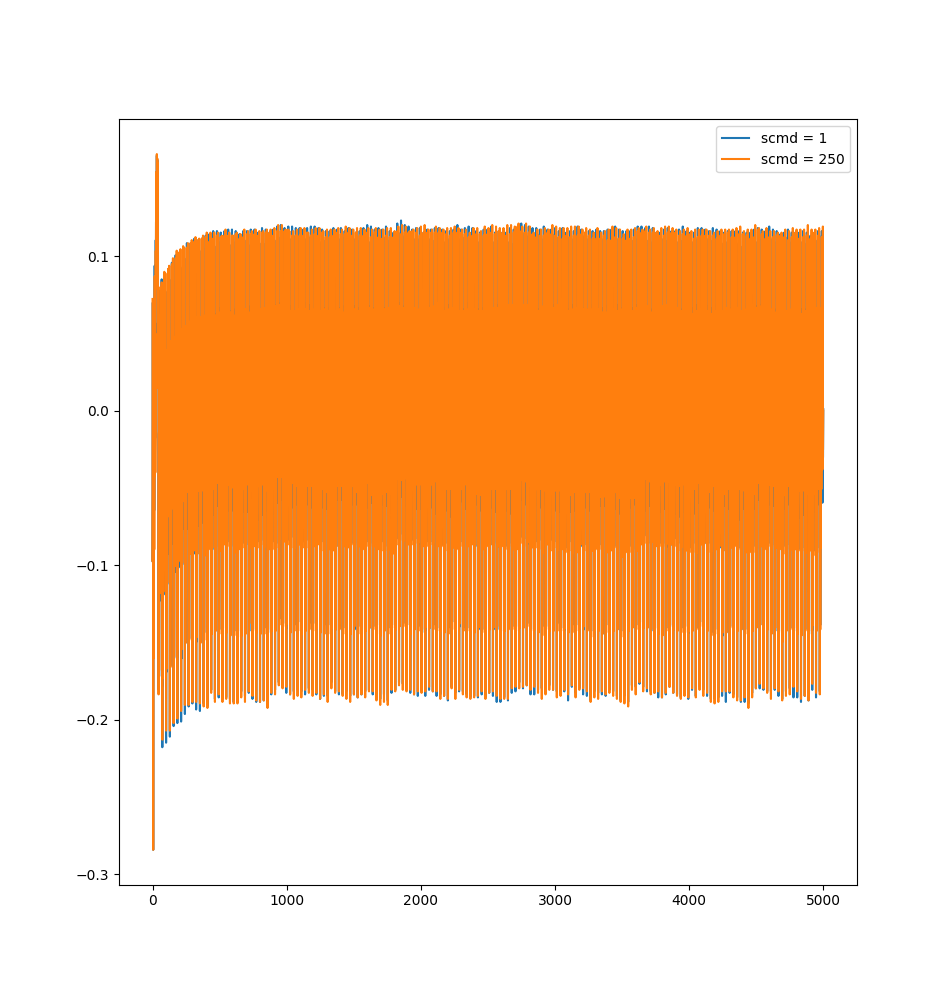
plt.plot(traces[0], label="scmd = {}".format(0))
plt.plot(traces[1], label="scmd = {}".format(250))
plt.legend()
plt.show()
Now this will show:
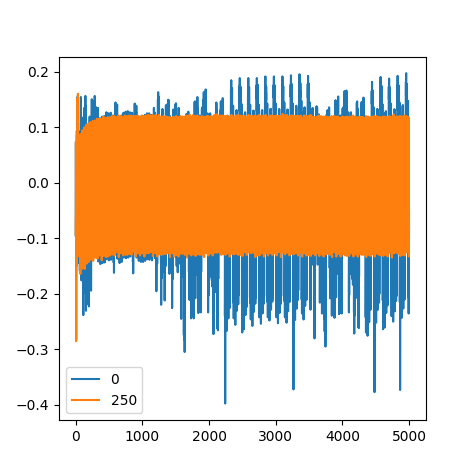
Which is actually what I want it to show, however I would like to compensate for the amount of clock cycles the one uses over the other. I read through a lot of documentation and found that this was a feature in the CWCapture tool, but it is incredibly difficult for me to simulate here.
What I have tried:
- Timing the python code and compensating for that.
- Looking at ways to time the target source, but this is rather hard since we can’t use most kernel calls.
- Looked at ways to perform some sort of calculation from the clock frequency, but as far as I can see there is no counter there.
- I have also just stretched the x-axis of the
scmd=250graph with a factor of 250, but this was too imprecise.
Would really love to know if someone has a nice idea. If needed I can put the code on GitHub.
I am even a bit doubtful that I am even capturing the right data. So if there is anything wrong with my capturing method, I would love the know as well.