Hello everyone,
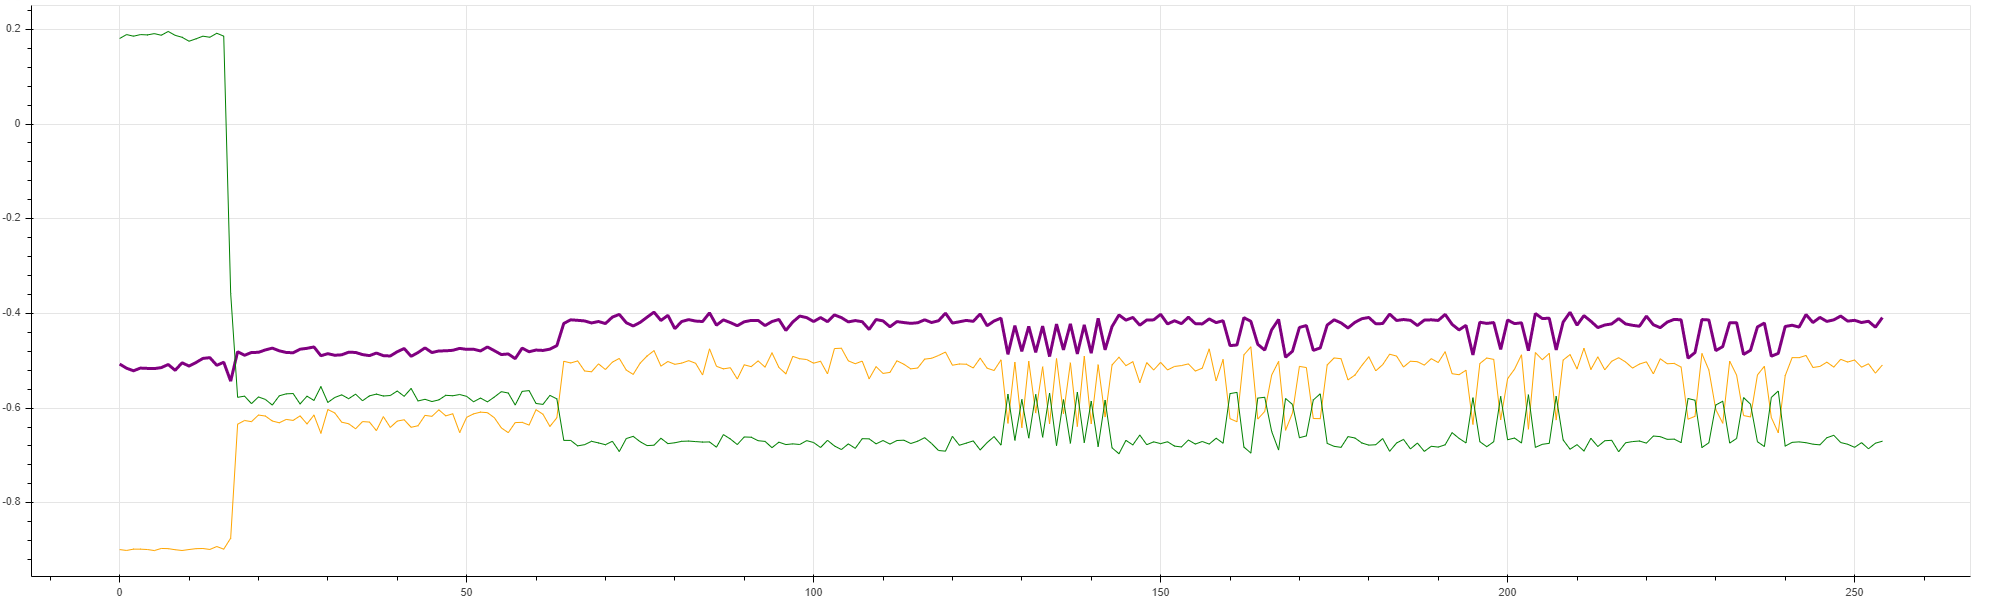
The plot listed here depicts the correlation coefficients of x, y, z coordinates, in the section “Correlation Attack”, whose colors are orange, purple, and green, respectively.
Does this plot coincide with the descriptions, " The correlation with the y-coordinate read is very good…"?
I just cannot tell any information from this purple curve. Or, does this the curve shape depend on my environment? Did I get a bad curve?
Alan
Hi Alan,
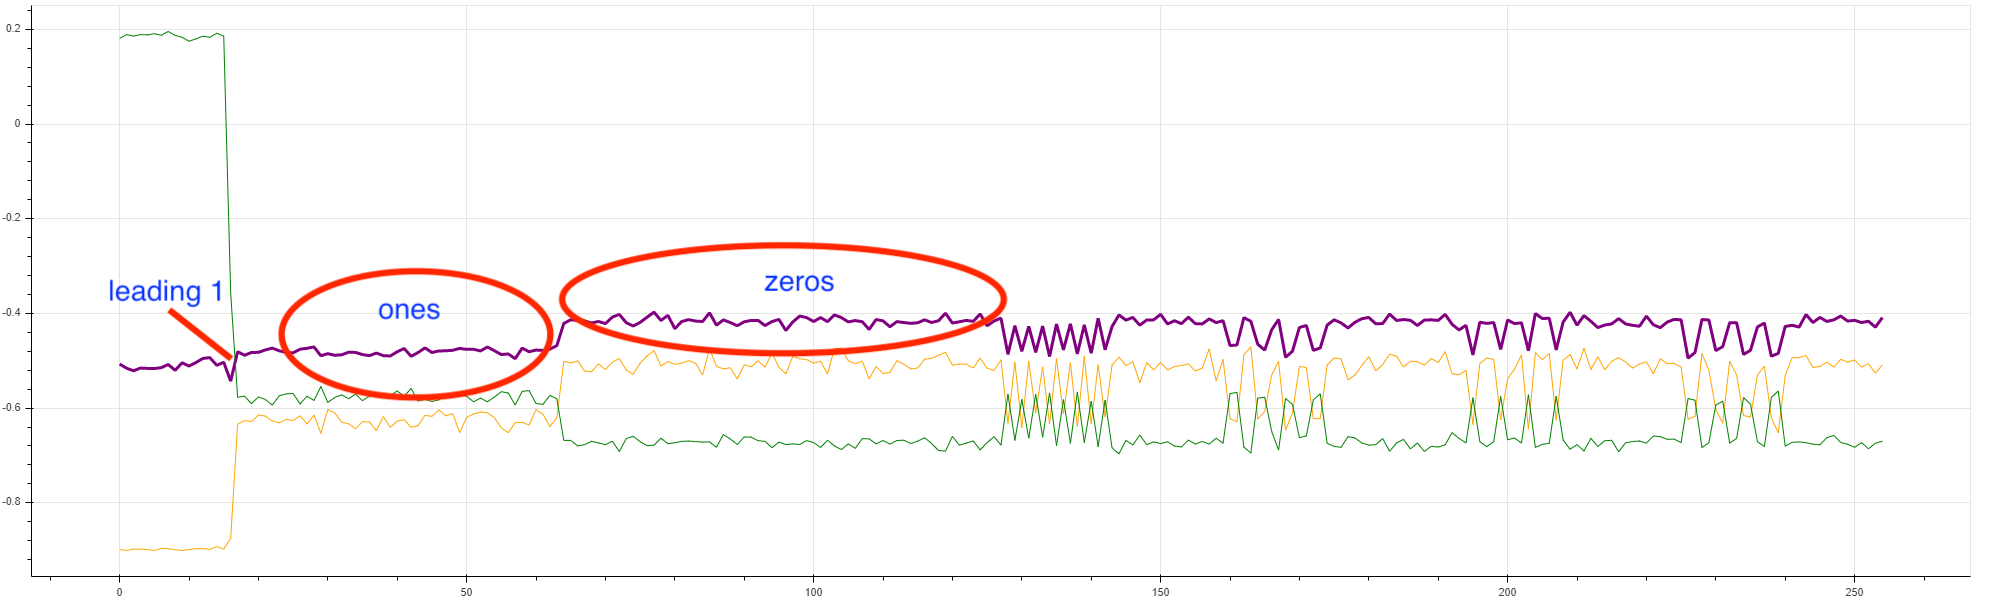
I don’t understand your question; to me the information about k is very clear on your purple curve:
Can you explain what you mean?
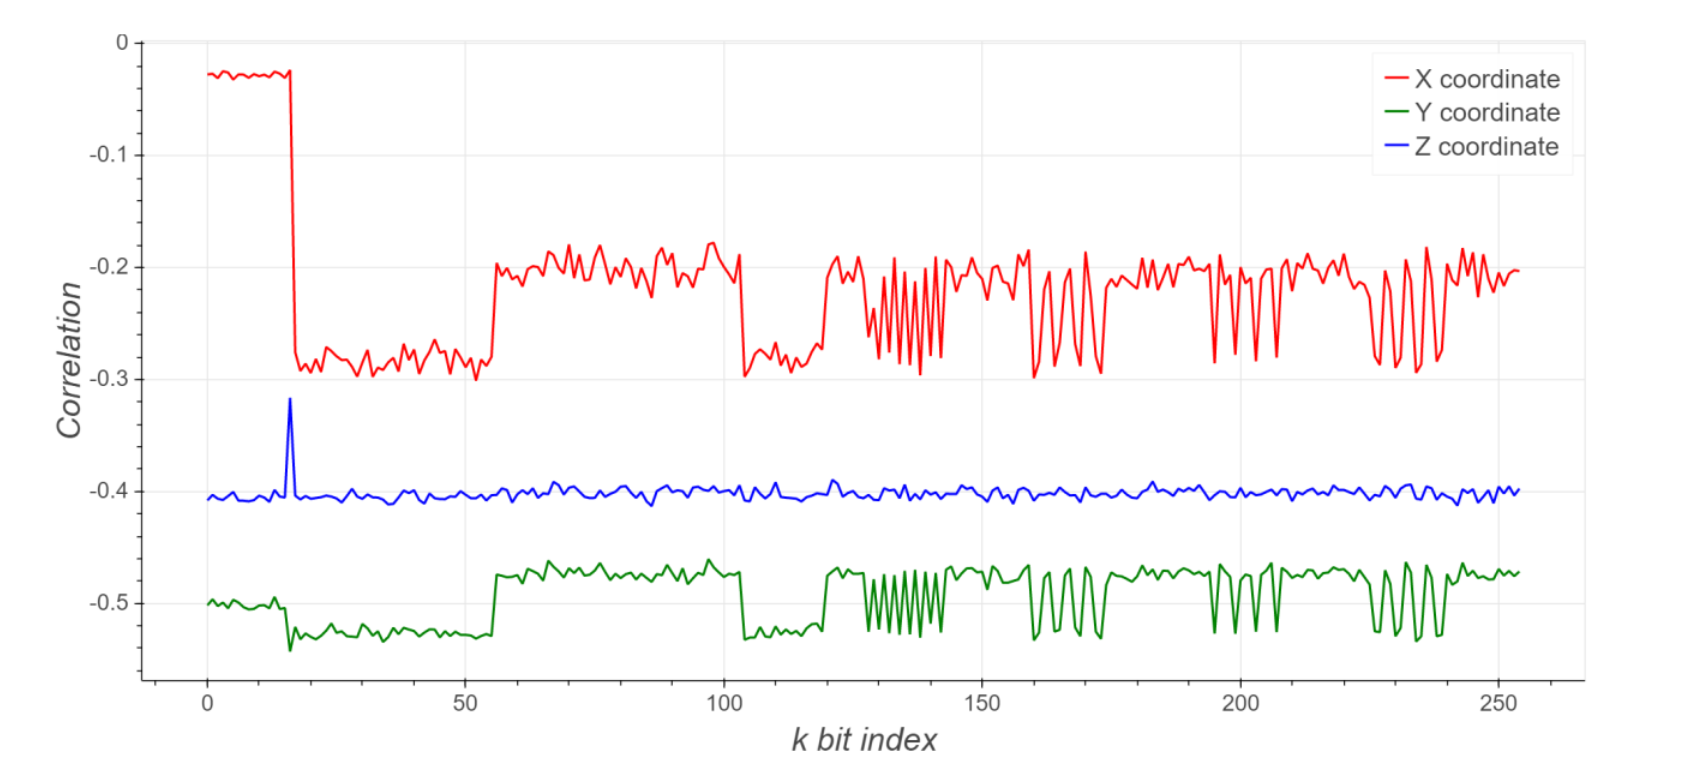
For reference, this is what I get:
For some reason you are getting somewhat different results, however the leakage is still clearly present; the attack should still succeed, although you may need to adjust some parameters (like initial_threshold and regular_threshold).
Jean-Pierre
Hi Alan,
2- I’m not sure I understand your question… Are you sure you haven’t gotten mixed up with your k values? i.e. was the plot that you shared above obtained with that random-looking k?. We can tell about the leading one’s presence just by observation; in the plots above, the sudden change around k index = 16 corresponds exactly with the position of the leading 1 in the k used to generate those plots. Moreover if you repeat the experiment with a different k, where you move around the leading 1 (but keeping all other bits the same, to make the change more obvious), you’ll see that the first “jump” always lines up with the location of the leading one.
3- As shown in the notebook, when we use a known k with easily identifiable patterns of 1’s and 0’s we obtain something like this:
and we simply manually set a threshold at the halfway point between the power metric for 1’s vs that of 0’s. The “initial threshold” business complicates this a little bit but it’s the same idea.
Jean-Pierre
1 Like
Hey Jean,
- Sorry, you are right, I just mixed up k with that random-looking one, here k is
k = 0x0000ffffffffffff0000000000000000aaaa0000cccc00001111000033330000.
How do you know the patterns in the k index = 64~ 127 are zeros? I thought the zeros’ patterns should be low, but in this plot, they gained much higher than ones in the k index = 32~63.
- Ok, I need some time to chew on this idea.
Alan.
Easy - we know because we know! When building the attack, k is known. One could get into the physics of why the marker is higher when k=0, and not vice-versa. But from a side-channel attack (or defense!) point of view, this really doesn’t matter. What matters to us is that the marker is consistent, and thus useful towards a side-channel attack.
Jean-Pierre
1 Like
Hey Jean,
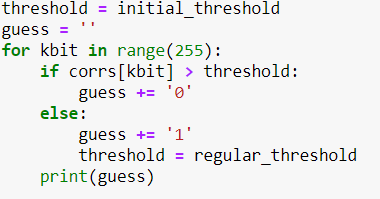
Could I ask why do we add a zero if the correlation at that bit is greater than the threshold? Shouldn’t it be smaller than threshold?
Alan.
Good question; this is indeed counterintuitive. If you follow the Verilog source you’ll see that the k-dependent memory writes are blocked when k is high, not when it is low. Why that is, I don’t know. One would expect, based on a textbook implementation of point multiplication, for it to be the opposite. Now if I wanted to fully understand the nuts and bolts of this ECC implementation, I would figure out why. But this isn’t necessary for side-channel attacks. Or, to quote an excellent paper (also on ECC) that I recently read:
Details of the real implementation are not our concern here, a high-level understanding of the countermeasures is good enough.
So that is why zeros have a higher correlation.
Jean-Pierre
1 Like