Here is my code for target setup:
# ============================================================================
# SCOPE AND TARGET SETUP
# ============================================================================
print("Setting up ChipWhisperer scope...")
scope = cw.scope()
scope.default_setup()
# Configure sample settings
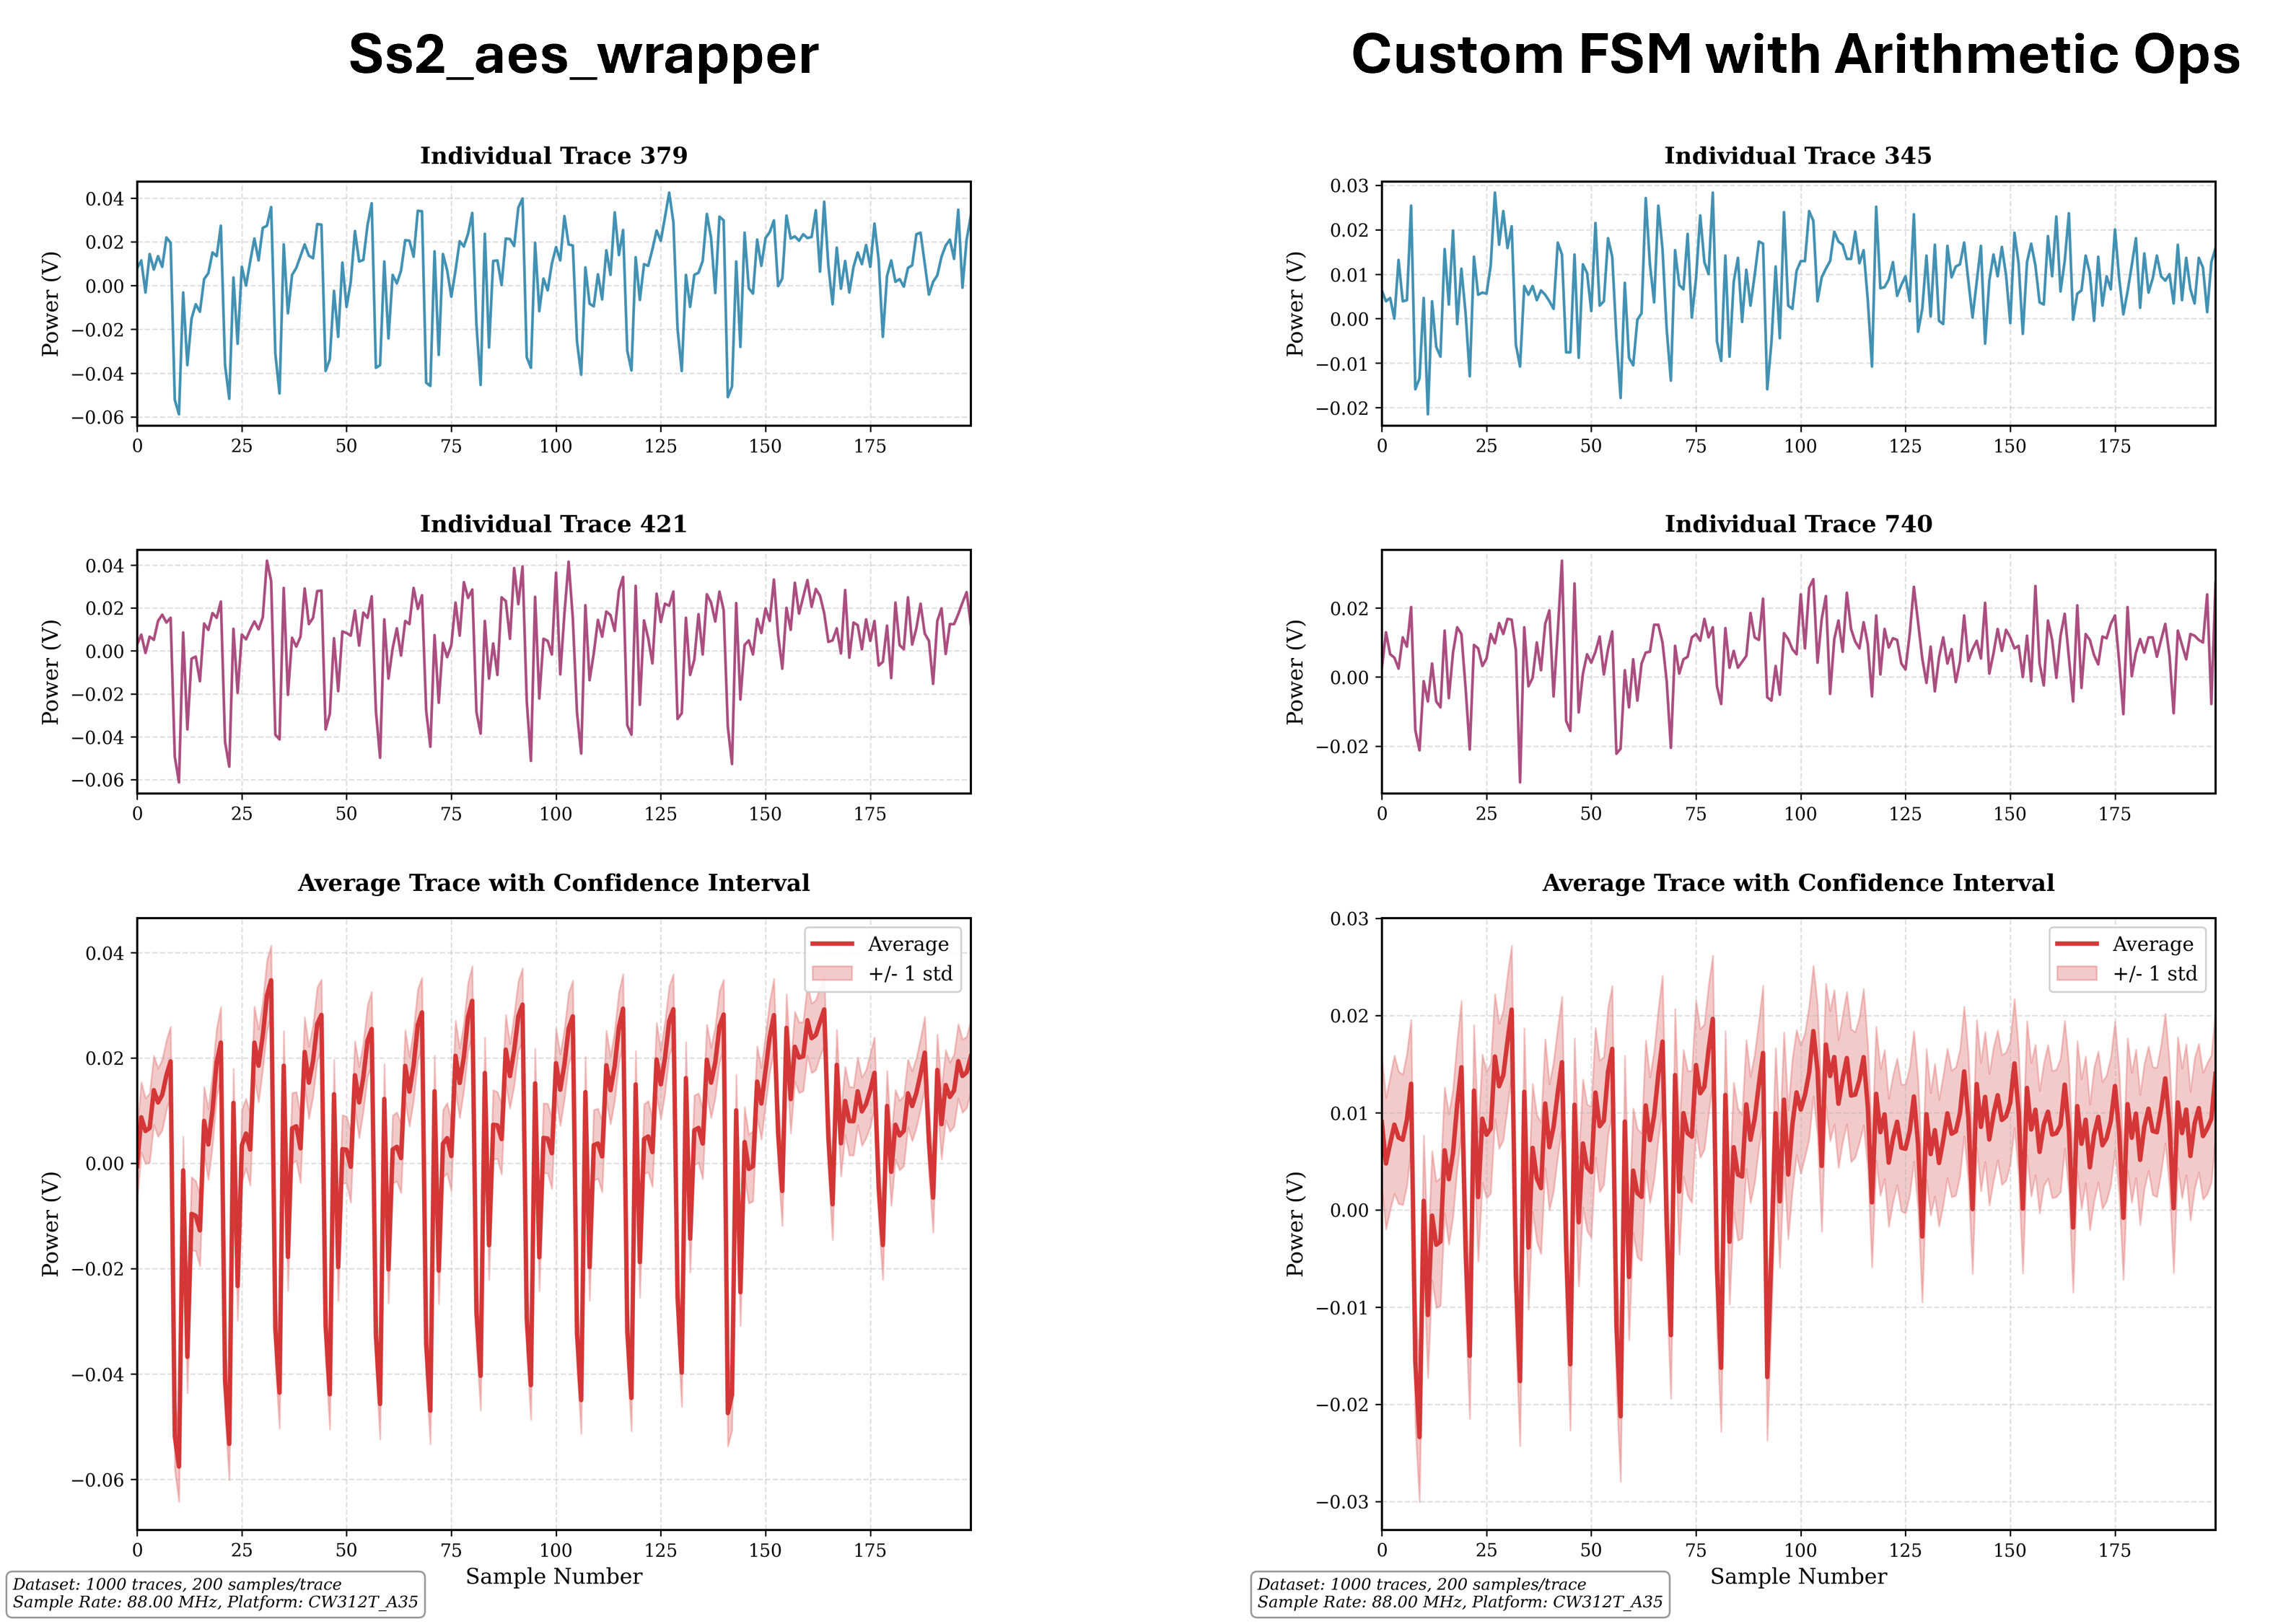
scope.adc.samples = 200 # More samples for detailed analysis
scope.adc.offset = 0
scope.adc.basic_mode = "rising_edge"
scope.trigger.triggers = "tio4"
scope.io.tio1 = "serial_rx"
scope.io.tio2 = "serial_tx"
# Target platform configuration for CW312T_A35
TARGET_PLATFORM = 'CW312T_A35'
print(f"Target platform: {TARGET_PLATFORM}")
scope.io.hs2 = 'clkgen'
scope.gain.db = 25
platform = 'ss2_a35'
print("Connecting to target...")
target = cw.target(scope, cw.targets.CW305, force=False, fpga_id=None, platform=platform, program=False)
# Clock configuration
scope.clock.clkgen_freq = 7.37e6
scope.io.hs2 = 'clkgen'
if scope._is_husky:
scope.clock.clkgen_src = 'system'
scope.clock.adc_mul = 12
scope.clock.reset_dcms()
else:
scope.clock.adc_src = "clkgen_x4"
time.sleep(0.1)
# Test connection
try:
target._ss2_test_echo()
print("Target connection test passed")
except:
print("Warning: Target echo test failed, continuing anyway...")
# ============================================================================
# PROGRAM FPGA FROM BITSTREAM
# ============================================================================
print(f"\nProgramming FPGA from bitstream...")
print(f"Bitstream path: {BITSTREAM_PATH}")
if os.path.exists(BITSTREAM_PATH):
try:
# Import the FPGA programmer
from chipwhisperer.hardware.naeusb.programmer_targetfpga import CW312T_XC7A35T
# Create FPGA programmer object
fpga = CW312T_XC7A35T(scope)
# Temporarily disable HS2 during programming
scope.io.hs2 = None
# Program the FPGA with the bitstream
fpga.program(BITSTREAM_PATH, sck_speed=10e6)
print("FPGA programming successful!")
# Re-enable HS2 after programming
scope.io.hs2 = 'clkgen'
# Wait for programming to complete
time.sleep(2)
# Test if target is responsive after programming
try:
target._ss2_test_echo()
print("FPGA programmed and responsive")
except:
print("Warning: FPGA programmed but echo test failed")
except Exception as e:
print(f"Error programming FPGA: {e}")
print("Continuing with default firmware...")
# Make sure HS2 is still enabled even if programming failed
scope.io.hs2 = 'clkgen'
else:
print(f"Bitstream file not found: {BITSTREAM_PATH}")
print("Continuing with default firmware...")
# Lock ADC
print("Locking ADC...")
for i in range(5):
scope.clock.reset_adc()
time.sleep(1)
if scope.clock.adc_locked:
break
if scope.clock.adc_locked:
print("ADC locked successfully")
else:
print("Warning: ADC failed to lock")
print("Hardware setup complete!")
- I did not use scope.clock.pll._allow_rdiv = True
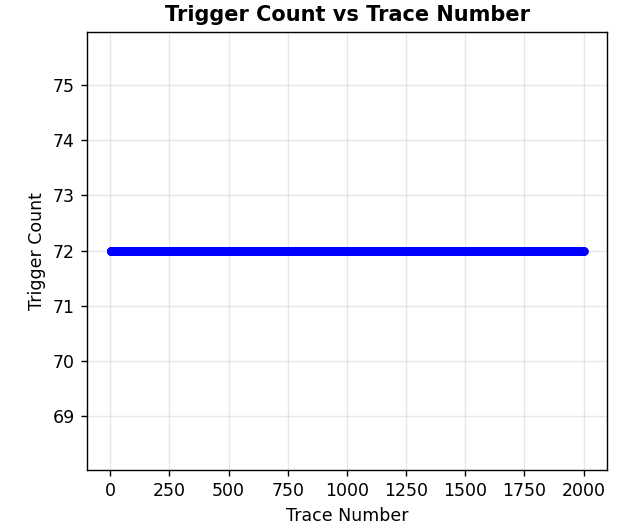
- Also, can you please explain “Double-check that your target is running in constant time, and make its starting conditions identical.”?
Thanks for your reply.