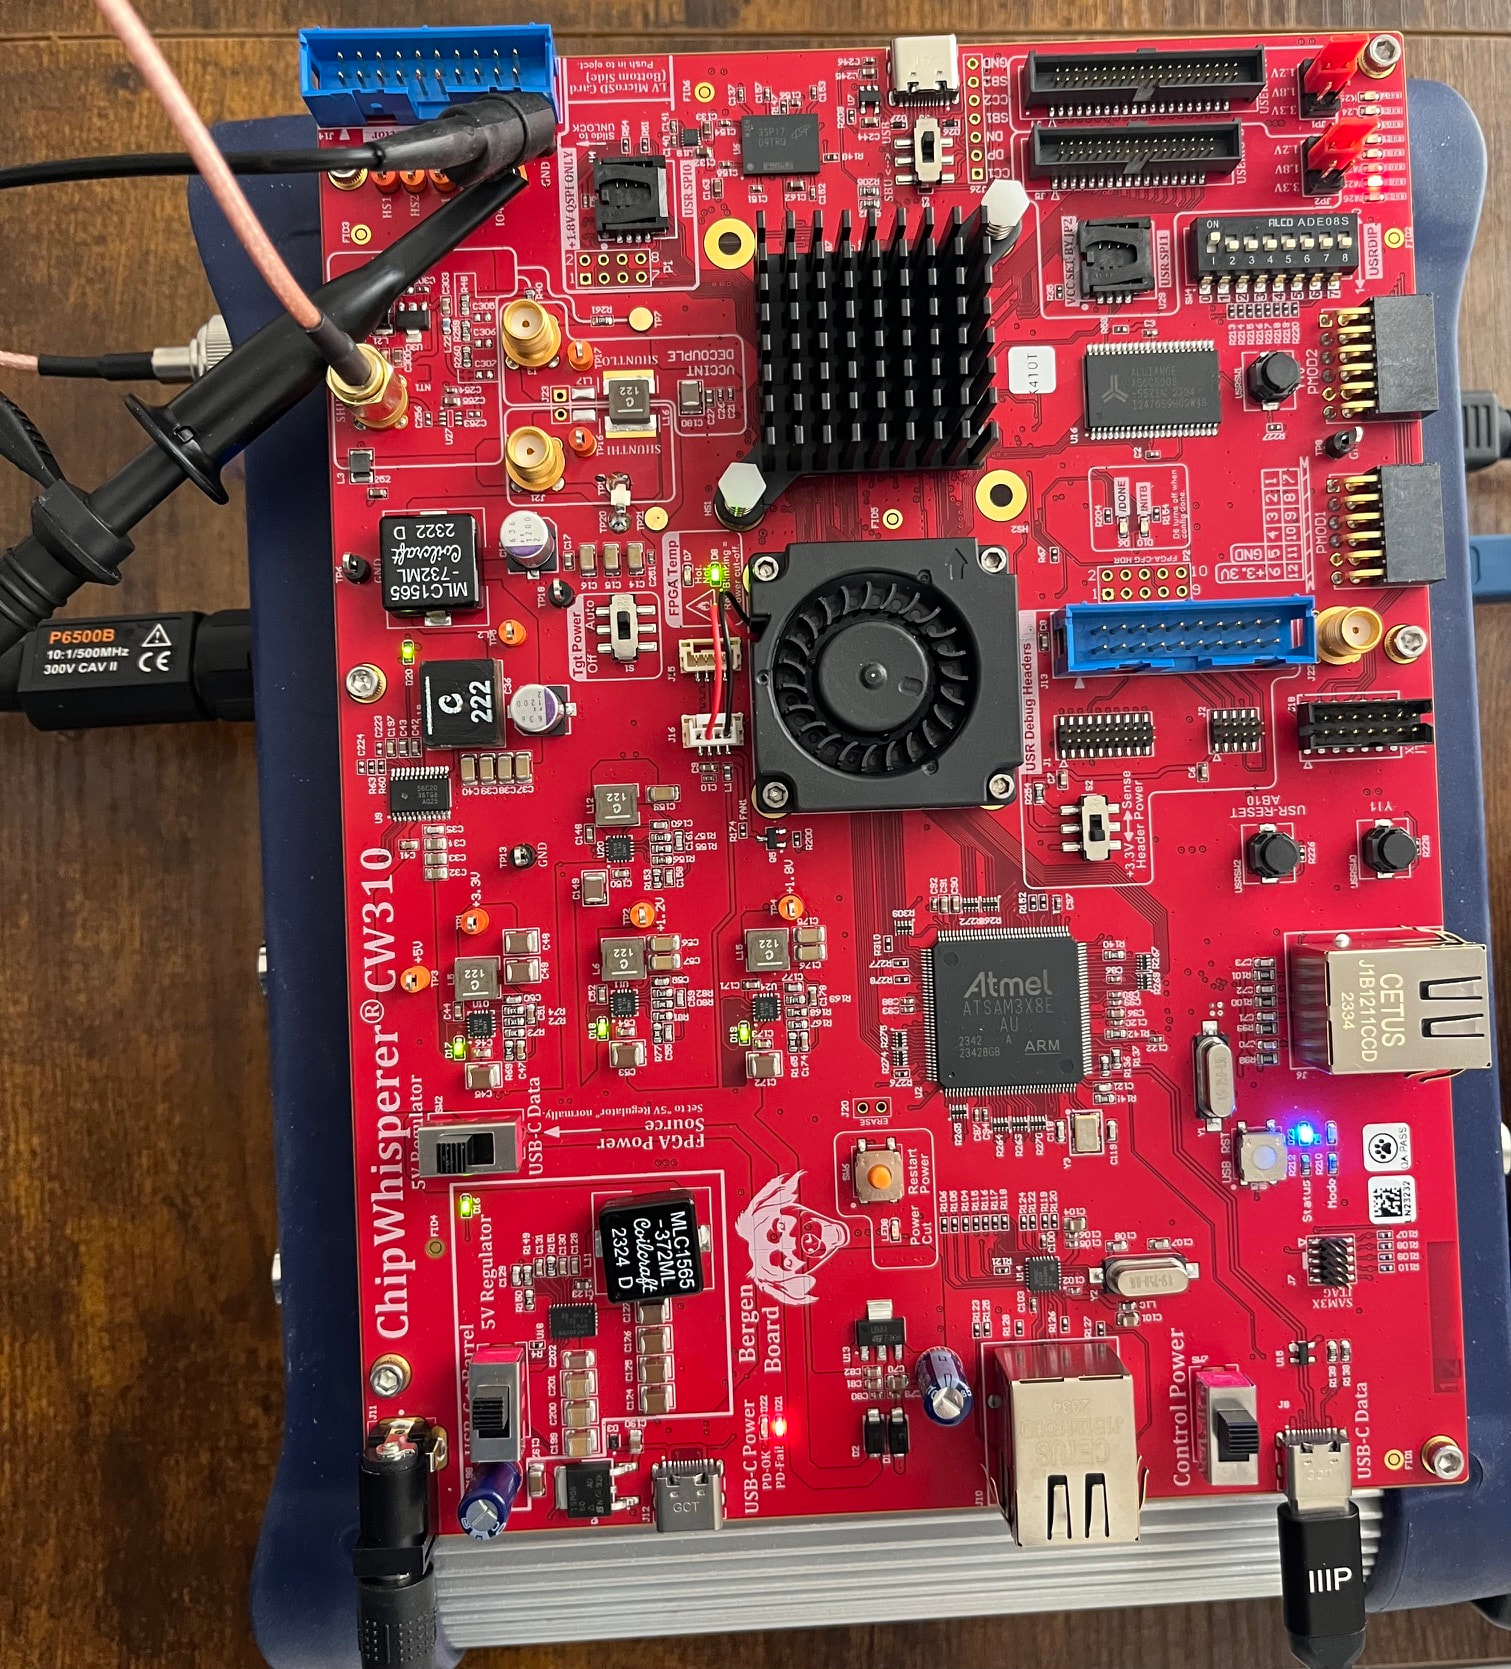
Hi everyone,
I am using a CW310 Bergen board with the default AES example running on the FPGA. The encryption results are correct, so the AES implementation seems to work properly.
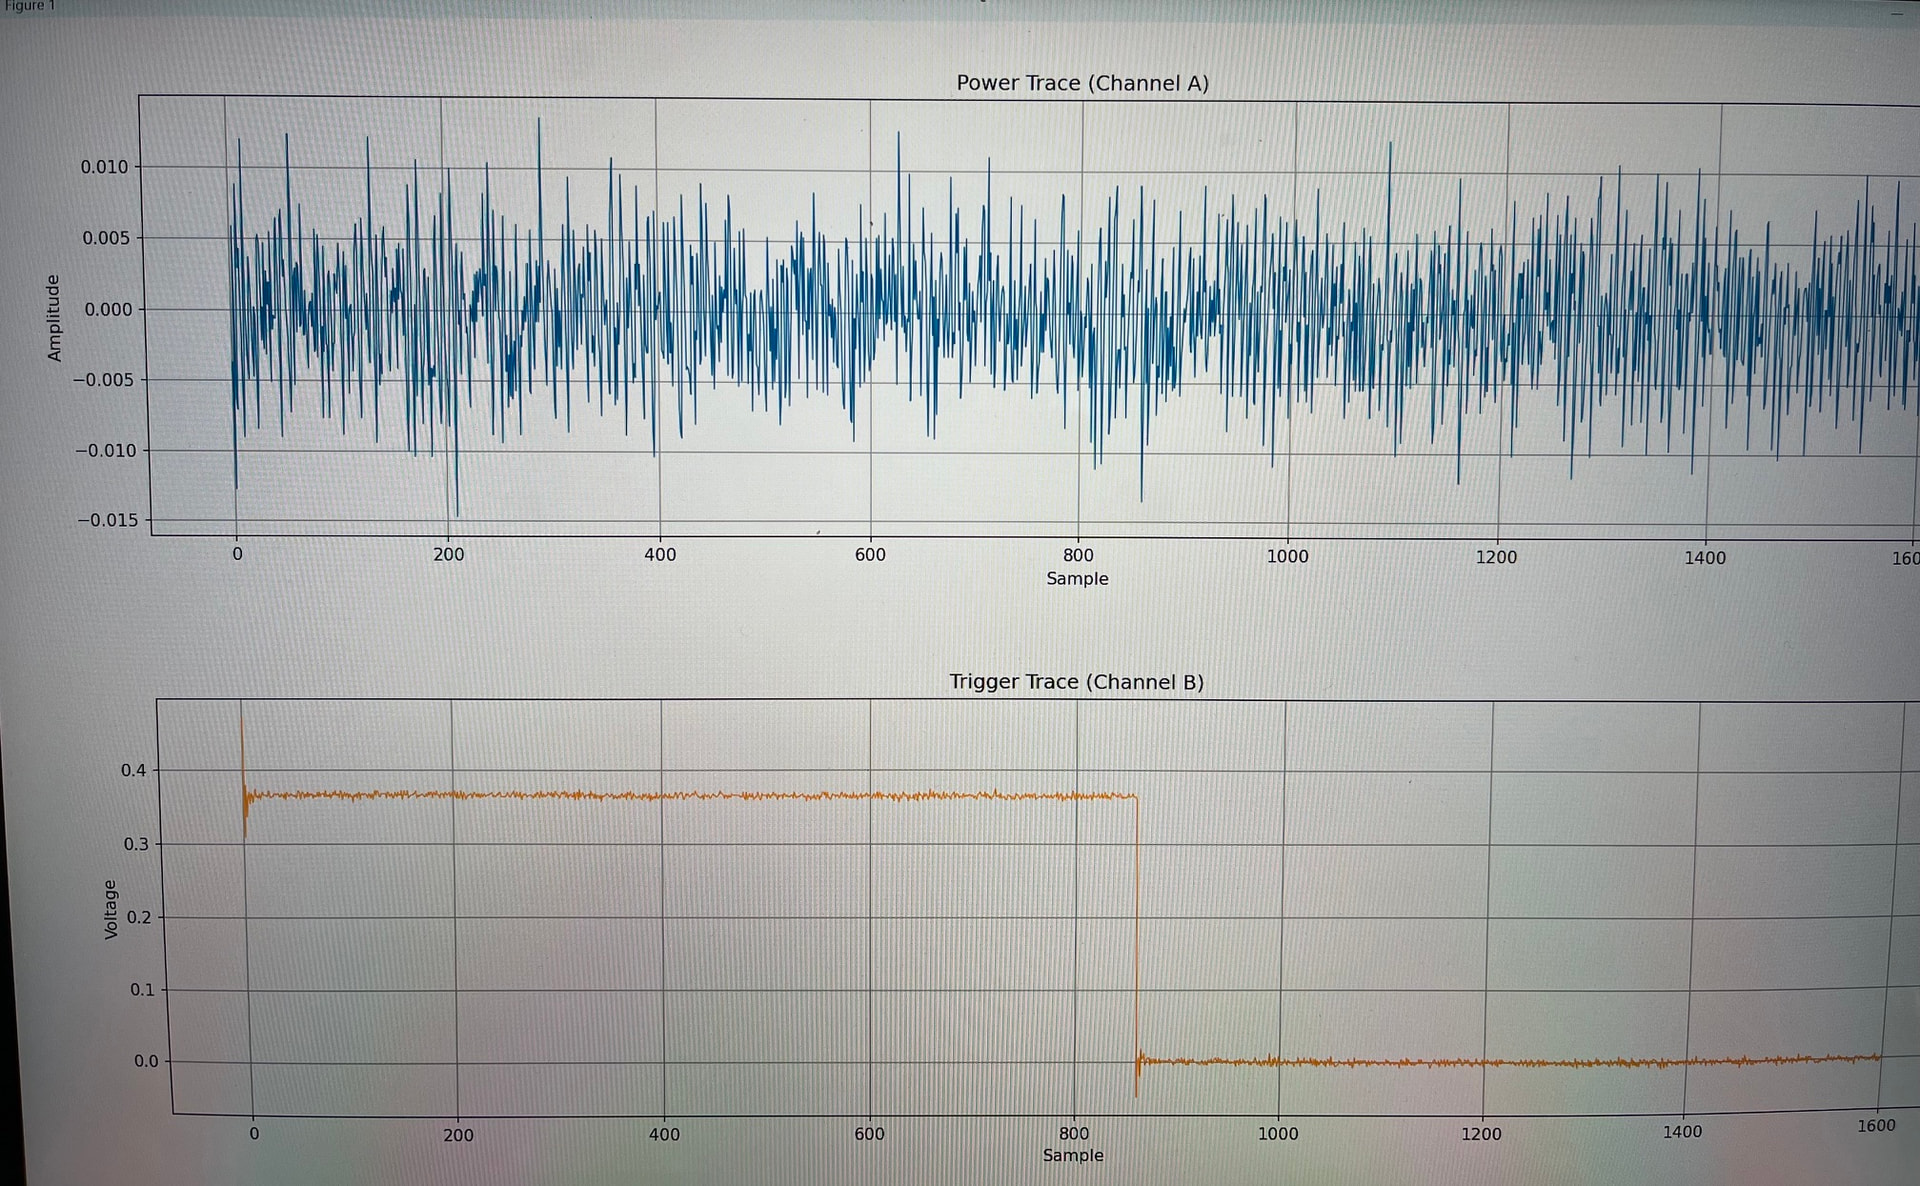
However, the traces do not show distinguishable AES activity as I expected.
I am wondering if I am doing something wrong in the measurement setup.
Has anyone experienced something similar with the Bergen board and PicoScope 6000?
Thanks!
import sys
import os
current_dir = os.path.dirname(os.path.abspath(__file__))
parent_dir = os.path.dirname(current_dir)
sys.path.append(parent_dir)

from capture.newps600a import PS6000a

def pico_settings():
    target_freq = 10E6

    total_core_cycle = 2000
    desired_sampling_free = 156e6   #Hz
    desired_no_sample_per_Clk = desired_sampling_freq/target_freq
    desired_sample_per_trace = total_core_cycle * desired_no_sample_per_Clk
    desired_sampling_interval = 1/desired_sampling_freq #ns
    desired_sampling_duration = desired_sample_per_trace * desired_sampling_interval*1.2


    try:

        RESOLUTION    = "10"
        CHANNEL       = "A"
        COUPLING      = "AC"
        CHAN_RANGE    = 0.1
        TRIGGER_CHAN  = "B"
        TRIGGER_RANGE = 1
        TRIGGER_EDGE  = 'Rising'
        TRIGGER_THRESHOLD = 0.3

        if (TRIGGER_CHAN == "TriggerAux"):
            TRIGGER_THRESHOLD = 0  # V

        picoscope = PS6000a(RESOLUTION)
        picoscope.set_channel(CHANNEL, COUPLING, CHAN_RANGE)
        picoscope.set_channel(TRIGGER_CHAN, COUPLING, TRIGGER_RANGE)
        picoscope.set_trigger(TRIGGER_CHAN, threshold_V=TRIGGER_THRESHOLD, timeout_ms= 10000, direction=TRIGGER_EDGE)

        SAMPLING_INTERVAL, NUM_SAMPLES, SAMPLING_FREQ = picoscope.set_no_smaple(desired_sampling_interval, desired_sampling_duration)
        NO_SAMPLE_PER_CLK = SAMPLING_FREQ/target_freq
        SAMPLING_DURATION = NUM_SAMPLES / SAMPLING_FREQ


        print("Sampling Interval:     ", SAMPLING_INTERVAL*1e9, "ns")
        print("Sampling Frequency:    ", SAMPLING_FREQ/1e6, "MHz")
        print("Target Frequency:      ", target_freq/1e6, "MHz")
        print("Sample per Clk:        ", NO_SAMPLE_PER_CLK)
        print("Sampling Duration:     ", SAMPLING_DURATION*1e3, "ms")
        print("Total sample per trace:", NUM_SAMPLES)


        print("=============================================")

    except Exception as e:
        print("Couldn't found Picoscope")
        print("Error:", str(e))

    return picoscope , NUM_SAMPLES
import os
import time
import numpy as np
import matplotlib.pyplot as plt
from Crypto.Cipher import AES

import chipwhisperer as cw
from tqdm import trange

from pico_settings import pico_settings

# --------------------------------------------------
# 1) CW310 + bitstream
# --------------------------------------------------
scope = None


bsfile = r"..\..\cw310_top.bit"
target = cw.target(scope, cw.capture.targets.CW310, bsfile=bsfile, force=True)

target.vccint_set(1.0)
# Clock setup
target.pll.pll_outenable_set(False, 0)
target.pll.pll_outenable_set(False, 1)
target.pll.pll_outenable_set(True, 2)

target.pll.pll_outfreq_set(2e6, 2)
target.pll.pll_outfreq_set(2e6, 1)

picoscope, NUM_SAMPLES = pico_settings()

ktp = cw.ktp.Basic()
ktp.fixed_key = True
ktp.fixedPlain = False

key = bytes.fromhex("00112233445566778899aabbccddeeff")
pt  = bytes.fromhex("000102030405060708090a0b0c0d0e0f")
traces = []
textin = []
keys = []
N = 5  # Number of traces

cipher = AES.new(key, AES.MODE_ECB)
expected_ct = cipher.encrypt(pt)

key, text = ktp.next()
cipher = AES.new(bytes(key), AES.MODE_ECB)

for i in trange(N, desc='Capturing traces'):
    key, text = ktp.next()  # manual creation of a key, text pair can be substituted here
    textin.append(text)
    keys.append(key)

    reversed_key = key[::-1]
    reversed_text = text[::-1]

    try:
        picoscope.arm()
    except:
        pass

    target.fpga_write(target.REG_CRYPT_KEY, reversed_key)
    target.fpga_write(target.REG_CRYPT_TEXTIN, reversed_text)

    time.sleep(0.01)

    target.usb_trigger_toggle()

    time.sleep(0.03)

    trace_A = np.asarray(picoscope.read_trace("A"))  # power
    trace_B = np.asarray(picoscope.read_trace("B"))  # trigger

    print("Trace A len:", len(trace_A))
    print("Trace B len:", len(trace_B))

    for _ in range(50):
        output2 = target.fpga_read(target.REG_CRYPT_CIPHEROUT, 16)
        if output2 != [255] * 16:
            break
        time.sleep(0.001)

    reversed_output2 = output2[::-1]
    print("Received: ", list(reversed_output2))
    print("Expected: ", list(cipher.encrypt(bytes(text))))


    traces.append(trace_A)


    plt.figure(figsize=(12, 6))

    plt.subplot(2, 1, 1)
    plt.plot(trace_A[0:1600], linewidth=0.8)
    plt.title("Power Trace (Channel A)")
    plt.xlabel("Sample")
    plt.ylabel("Amplitude")
    plt.grid(True)

    plt.subplot(2, 1, 2)
    plt.plot(trace_B[0:1600], linewidth=0.8, color='orange')
    plt.title("Trigger Trace (Channel B)")
    plt.xlabel("Sample")
    plt.ylabel("Voltage")
    plt.grid(True)

    plt.tight_layout()
    plt.show()