Debugging the CW308 error

Hi!

I am trying to follow the following notebook to debug a target:

I have chipwhisperer installed in a Ubuntu 22.04 through WSL.
However I get the following error:

jtag
Info : DEPRECATED target event trace-config; use TPIU events {pre,post}-{enable,disable}
Error: failed to reset FTDI device: LIBUSB_ERROR_PIPE
Error: unable to open ftdi device with vid 2b3e, pid ace5, description ‘', serial '’ at bus location ‘*’

Any idea on why this happens?
I attach the notebook with cell results.
Debugging the CW308_STM32F3 Using ChipWhisperer.zip (3.6 KB)

Hi,

Your attached notebook doesn’t have any output.

I don’t recommend using WSL, as, unless things have changed, it doesn’t allow any USB access.

Alex

Yes I am connecting following this instructions.

Maybe connecting trough the WSL like this is what is interfering with the debugger? I tried this way to avoid the windows limitations.

Sorry about the file, I did not save it… Now should be ok.
Debugging the CW308_STM32F3 Using ChipWhisperer.zip (6.9 KB)

Could it be that you need to reattach the device in usbipd-win after switching to MPSSE mode? Due to limited endpoints/USB memory on the SAM3U, we need to disconnect the ChipWhisperer and reenumerate as composite device with two custom vendor interfaces.

From what I understand, the USB server on the Windows end leaves devices alone until you attach them, so it might not auto reattach when the reenumeration happens.

Thanks Alex for your support. I will try that and let you know as I don’t have the hardware with me right now.
Do you think that it could be possible to debug a target using OpenOCD and gdb but with VScode visual interface through WSL?

That would be really nice!

Yeah, I agree that would be nice. I think I looked at that a while back and all the gdb support seemed to be targeting the x86/64 binary itself and so wasn’t compatible with arm-none-eabi-gdb and other embedded gdbs.

gdb does have a Python interface, but it was disabled for the windows build at least, so I didn’t have any luck there either. Basically, it seemed possible, but wasn’t really practical; I might’ve missed something, or wsl might change things there, though.

Alex

Hey Alex,

I tried again to debug the target, this time using the default windows install and using the Husky DIO Setup.

However when trying to upload firmware via JTAG I get the following error.

xPack OpenOCD x86_64 Open On-Chip Debugger 0.11.0+dev (2022-03-25-17:32)
Licensed under GNU GPL v2
For bug reports, read
	http://openocd.org/doc/doxygen/bugs.html
jtag
Info : DEPRECATED target event trace-config; use TPIU events {pre,post}-{enable,disable}
Info : clock speed 1000 kHz
Error: JTAG scan chain interrogation failed: all ones
Error: Check JTAG interface, timings, target power, etc.
Error: Trying to use configured scan chain anyway...
Error: stm32f3x.cpu: IR capture error; saw 0x0f not 0x01
Warn : Bypassing JTAG setup events due to errors
Error: Invalid ACK (7) in DAP response
Error: JTAG-DP STICKY ERROR

I don’t undertand what I am doing wrong… I understand that the recommended setup will be on a linux machine, but this should run on windows, isn’t it?

Hi,

I think there’s been some firmware fixes since that release, so you’ll need to grab those and update.

Alex

Do you mean the scope firmware?
It looks like the firmware version is higher than the latest available.

image

EDIT:
And if it reefers to cw version it seems that i am on 5.6.1

image

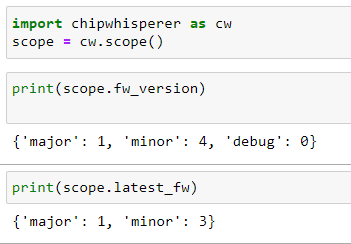
Yeah, the scope firmware. There’s been some fixes in software and firmware since the 5.6.1 release.

That should be the latest scope firmware. Can you try pulling the latest commit (ChipWhisperer Updating.ipynb should help) and seeing if that fixes your issue?

I have pulled the last commit and the error remains.

xPack OpenOCD x86_64 Open On-Chip Debugger 0.11.0+dev (2022-03-25-17:32)
Licensed under GNU GPL v2
For bug reports, read
	http://openocd.org/doc/doxygen/bugs.html
none separate

jtag
Info : DEPRECATED target event trace-config; use TPIU events {pre,post}-{enable,disable}
Info : clock speed 1000 kHz
Error: JTAG scan chain interrogation failed: all ones
Error: Check JTAG interface, timings, target power, etc.
Error: Trying to use configured scan chain anyway...
Error: stm32f3x.cpu: IR capture error; saw 0x0f not 0x01
Warn : Bypassing JTAG setup events due to errors
Error: Invalid ACK (7) in DAP response

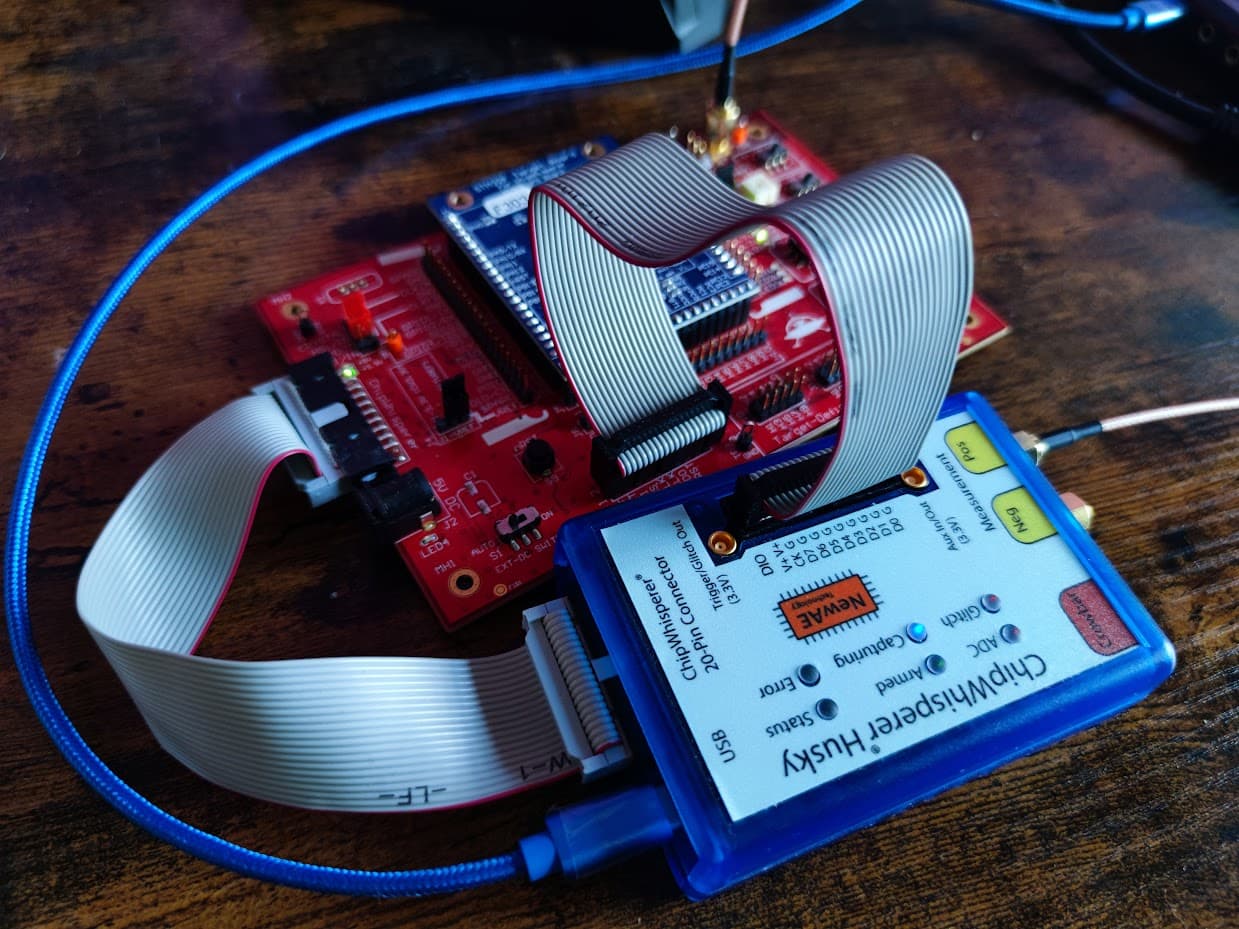
In that case, I’m not too sure. I’ll run through again, just to make sure everything works. Are you using the UserIO header, or are you going over the 20-pin?

Alex

Over the 20-pin I think. Image of the setup attached.

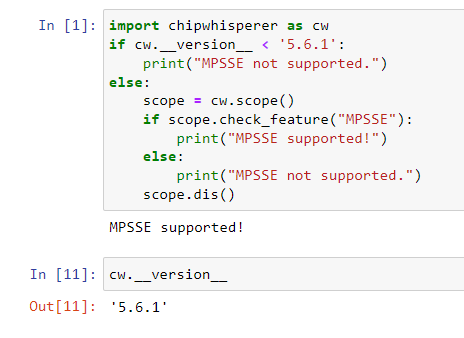
I’ve uploaded an update notebook. Basically, the fix is just to use scope.setup_MPSSE(1, husky_userio='jtag'), which wasn’t around when that notebook was made.

Alex