Feedback about curious correlation between lds

Hi,

I’m doing some experimentation with the Chipwhisperer-lite regarding power analysis, in particular how single instructions affect the power consumption. Long story short I encountered a curious effect regarding the instruction ld: it seems that power consumption of two lds is correlated by the hamming distance of the final value in their registers.

The strange thing is that the correlation appears at steps of two: in order to explain this better take this code (it simply implements a constant time password checking algorithm)

 75a:   80 93 05 06     sts 0x0605, r24 ; 0x800605 <__TEXT_REGION_LENGTH__+0x7de605>
 75e:   00 e0           ldi r16, 0x00   ; 0
 760:   d9 a0           ldd r13, Y+33   ; 0x21
 762:   fa a0           ldd r15, Y+34   ; 0x22
 764:   1b a1           ldd r17, Y+35   ; 0x23
 766:   ac a1           ldd r26, Y+36   ; 0x24
 768:   ed a1           ldd r30, Y+37   ; 0x25
 76a:   6e a1           ldd r22, Y+38   ; 0x26
 76c:   4f a1           ldd r20, Y+39   ; 0x27
 76e:   28 a5           ldd r18, Y+40   ; 0x28
 770:   89 a5           ldd r24, Y+41   ; 0x29
 772:   e9 80           ldd r14, Y+1    ; 0x01
 774:   de 24           eor r13, r14
 776:   0d 29           or  r16, r13
 778:   ea 80           ldd r14, Y+2    ; 0x02
 77a:   fe 24           eor r15, r14
 77c:   0f 29           or  r16, r15
 77e:   eb 80           ldd r14, Y+3    ; 0x03
 780:   1e 25           eor r17, r14
 782:   01 2b           or  r16, r17
 784:   ec 80           ldd r14, Y+4    ; 0x04
 786:   ae 25           eor r26, r14
 788:   0a 2b           or  r16, r26
 78a:   ed 80           ldd r14, Y+5    ; 0x05
 78c:   ee 25           eor r30, r14
 78e:   0e 2b           or  r16, r30
 790:   ee 80           ldd r14, Y+6    ; 0x06
 792:   6e 25           eor r22, r14
 794:   06 2b           or  r16, r22
 796:   ef 80           ldd r14, Y+7    ; 0x07
 798:   4e 25           eor r20, r14
 79a:   04 2b           or  r16, r20
 79c:   e8 84           ldd r14, Y+8    ; 0x08
 79e:   2e 25           eor r18, r14
 7a0:   02 2b           or  r16, r18
 7a2:   e9 84           ldd r14, Y+9    ; 0x09
 7a4:   8e 25           eor r24, r14
 7a6:   08 2b           or  r16, r24
 7a8:   01 11           cpse    r16, r1
 7aa:   ff cf           rjmp    .-2         ; 0x7aa <main+0xe4>

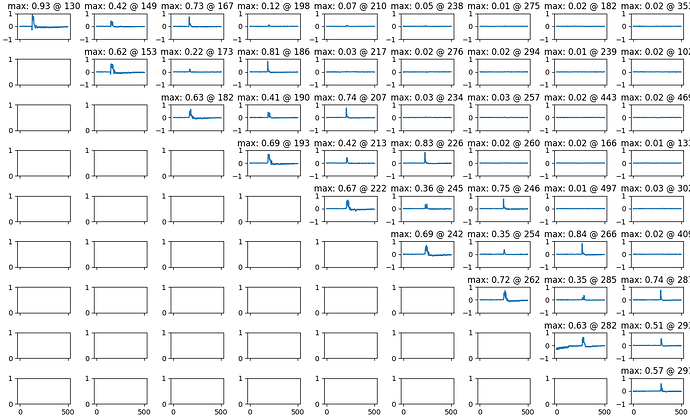
if I generate the correlation between couple of input bytes I obtain the following graph

(the entry at row i and column j indicates the correlation between the traces and input[i] xor input [j], instead in the diagonal the direct correlation with input[i]). The peaks appear at the position of the ld instructions.

Now my question is, is this a known effect, is there any literature regarding it?

Thanks for any feedback,

gp
Hi gp,

That’s an interesting observation you’ve made! As far as I know, that’s not an observation anyone’s made before, or at least they haven’t posted here about it. You might be seeing some “feedback” here from doing correlation of a linear operation - you also see some weird effects if you do a CPA attack on the XOR (AddRoundKey) of AES, for example. If you do a non linear operation on your input before doing the LD (basically load random data), do you still see the same relation?

Alex

@Alex_Dewar I don’t know if I’m understanding your point but this findings derive from the study of a constant time password check algorithm in which I’m able to derive the static key by using this correlation between lds (in this case, inside a loop, there is correlation between two adjacent lds). All these cases have random inputs, moreover the power consumption of the instruction ld shouldn’t derive from the “history” of the register the value is in (to answer the point about “non linear operation on your input before doing the ld”).

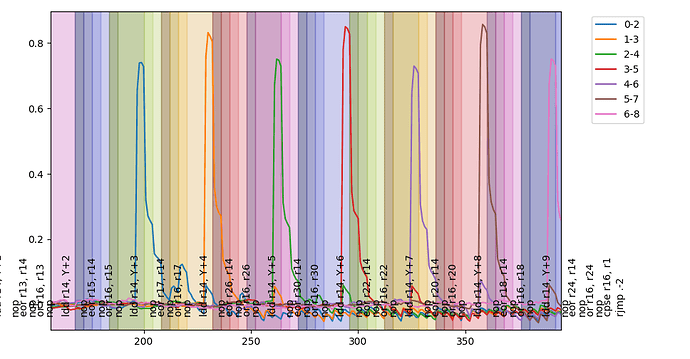
To add to my point: the peaks in the correlation graph are at the exact position where the lds happen (I also tested code with nops between them) so I’m pretty confident that is not an artifact of the measurement or an effect leaking from surrounding operations.

This for example the graph with the all the peaks annotated with instructions

Ah sorry, I misunderstood - those comments indicate memory offset, not the value in the memory. Your twitter thread has some nice additional context for this (hope you don’t mind be linking here).

My understanding is as follows, feel free to correct if I’m wrong on anything here:

The diagonal correlation makes sense here since that’s what’s actually being loaded. You might expect some relation as well with the distance between the new value and the previous one loaded in the register. Seeing a relationship with the distance between the new value and the one before last makes no sense though because that value has been cleared long ago and, furthermore, it doesn’t seem to be time based (i.e. increasing the time between loads doesn’t change the effect).

That’s really really weird, I agree. It looks to me like it’s behaving like there’s some sort of single value cache in there. Maybe they were trying to optimize (power saving?) for something like:

Ra <- mem @ X ; load
Ra <- f(Ra, Rb) ; some op
Rc <- Ra ; mov, maybe do a store?
Ra <- mem @ X ; reload old value

and implemented a cache for the previous value in each register.

Then, loading input[i+1] would move input[i] into this “cache” and loading input[i+2] would clear input[i]. I’m not very knowledgeable on CPU design though, so this might not make much sense.

no problem for the link to the twitter thread (how did you find it?).

Does exist some mailing list or some “internet place” where people discuss stuff like these?

Guilty as charged - it looked from this that you were up to very interesting things so I searched your name on twitter :wink:

We have a discord where you may be able to get some further discussion on these results.
Jean-Pierre