Finding the samples with leaking bits

Hello,

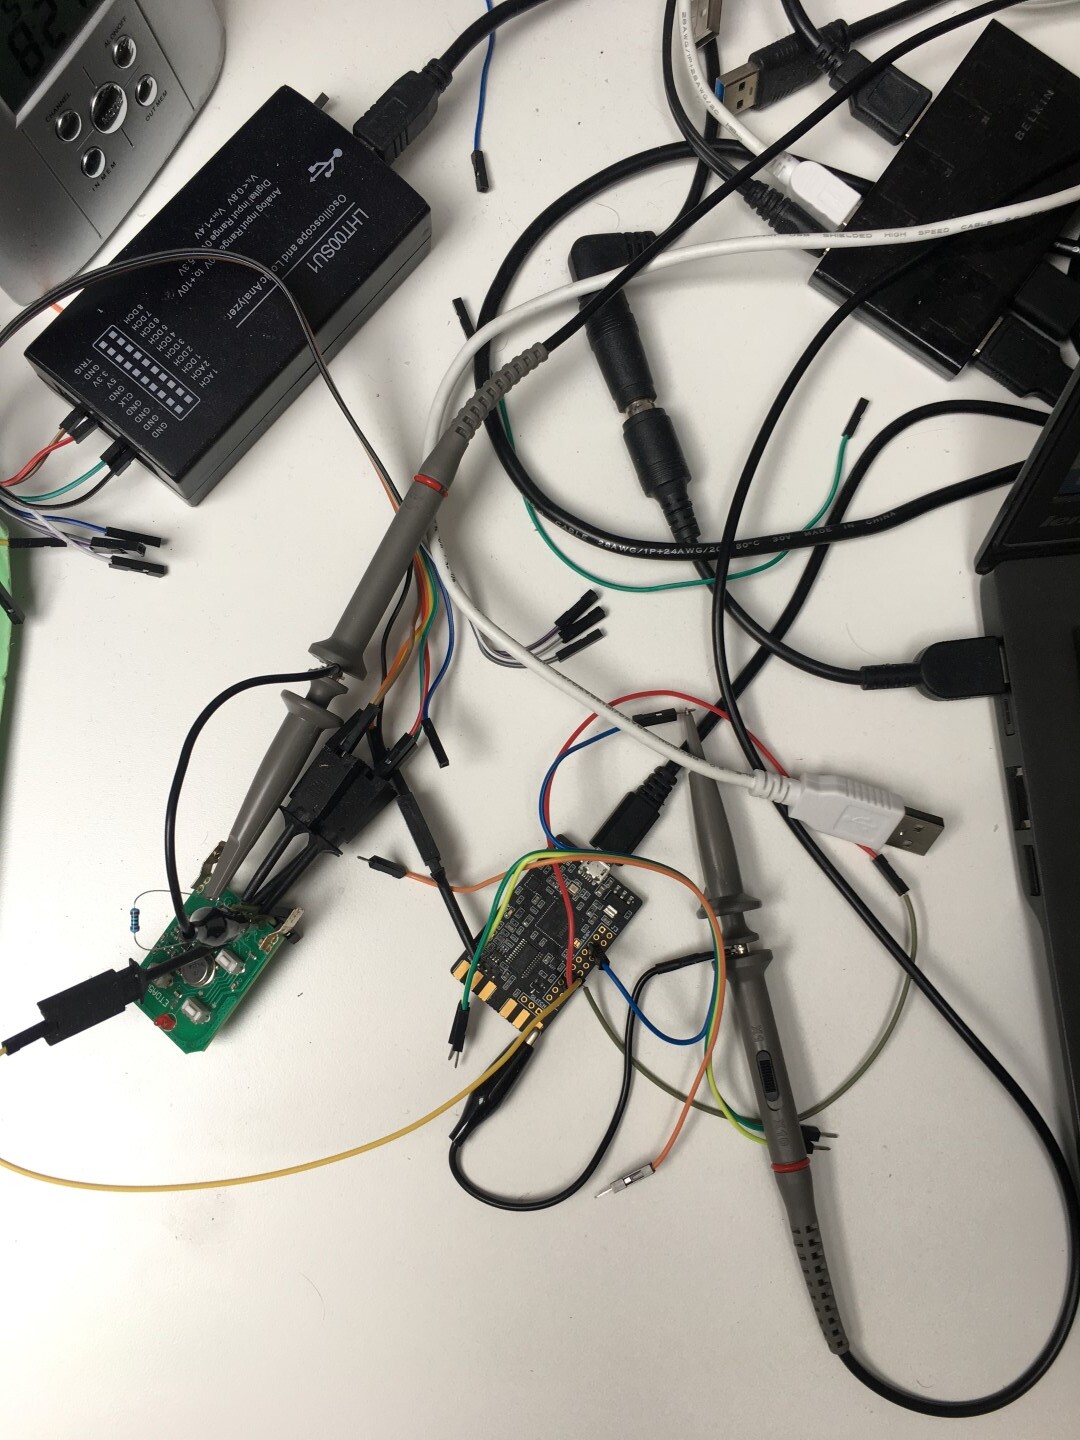
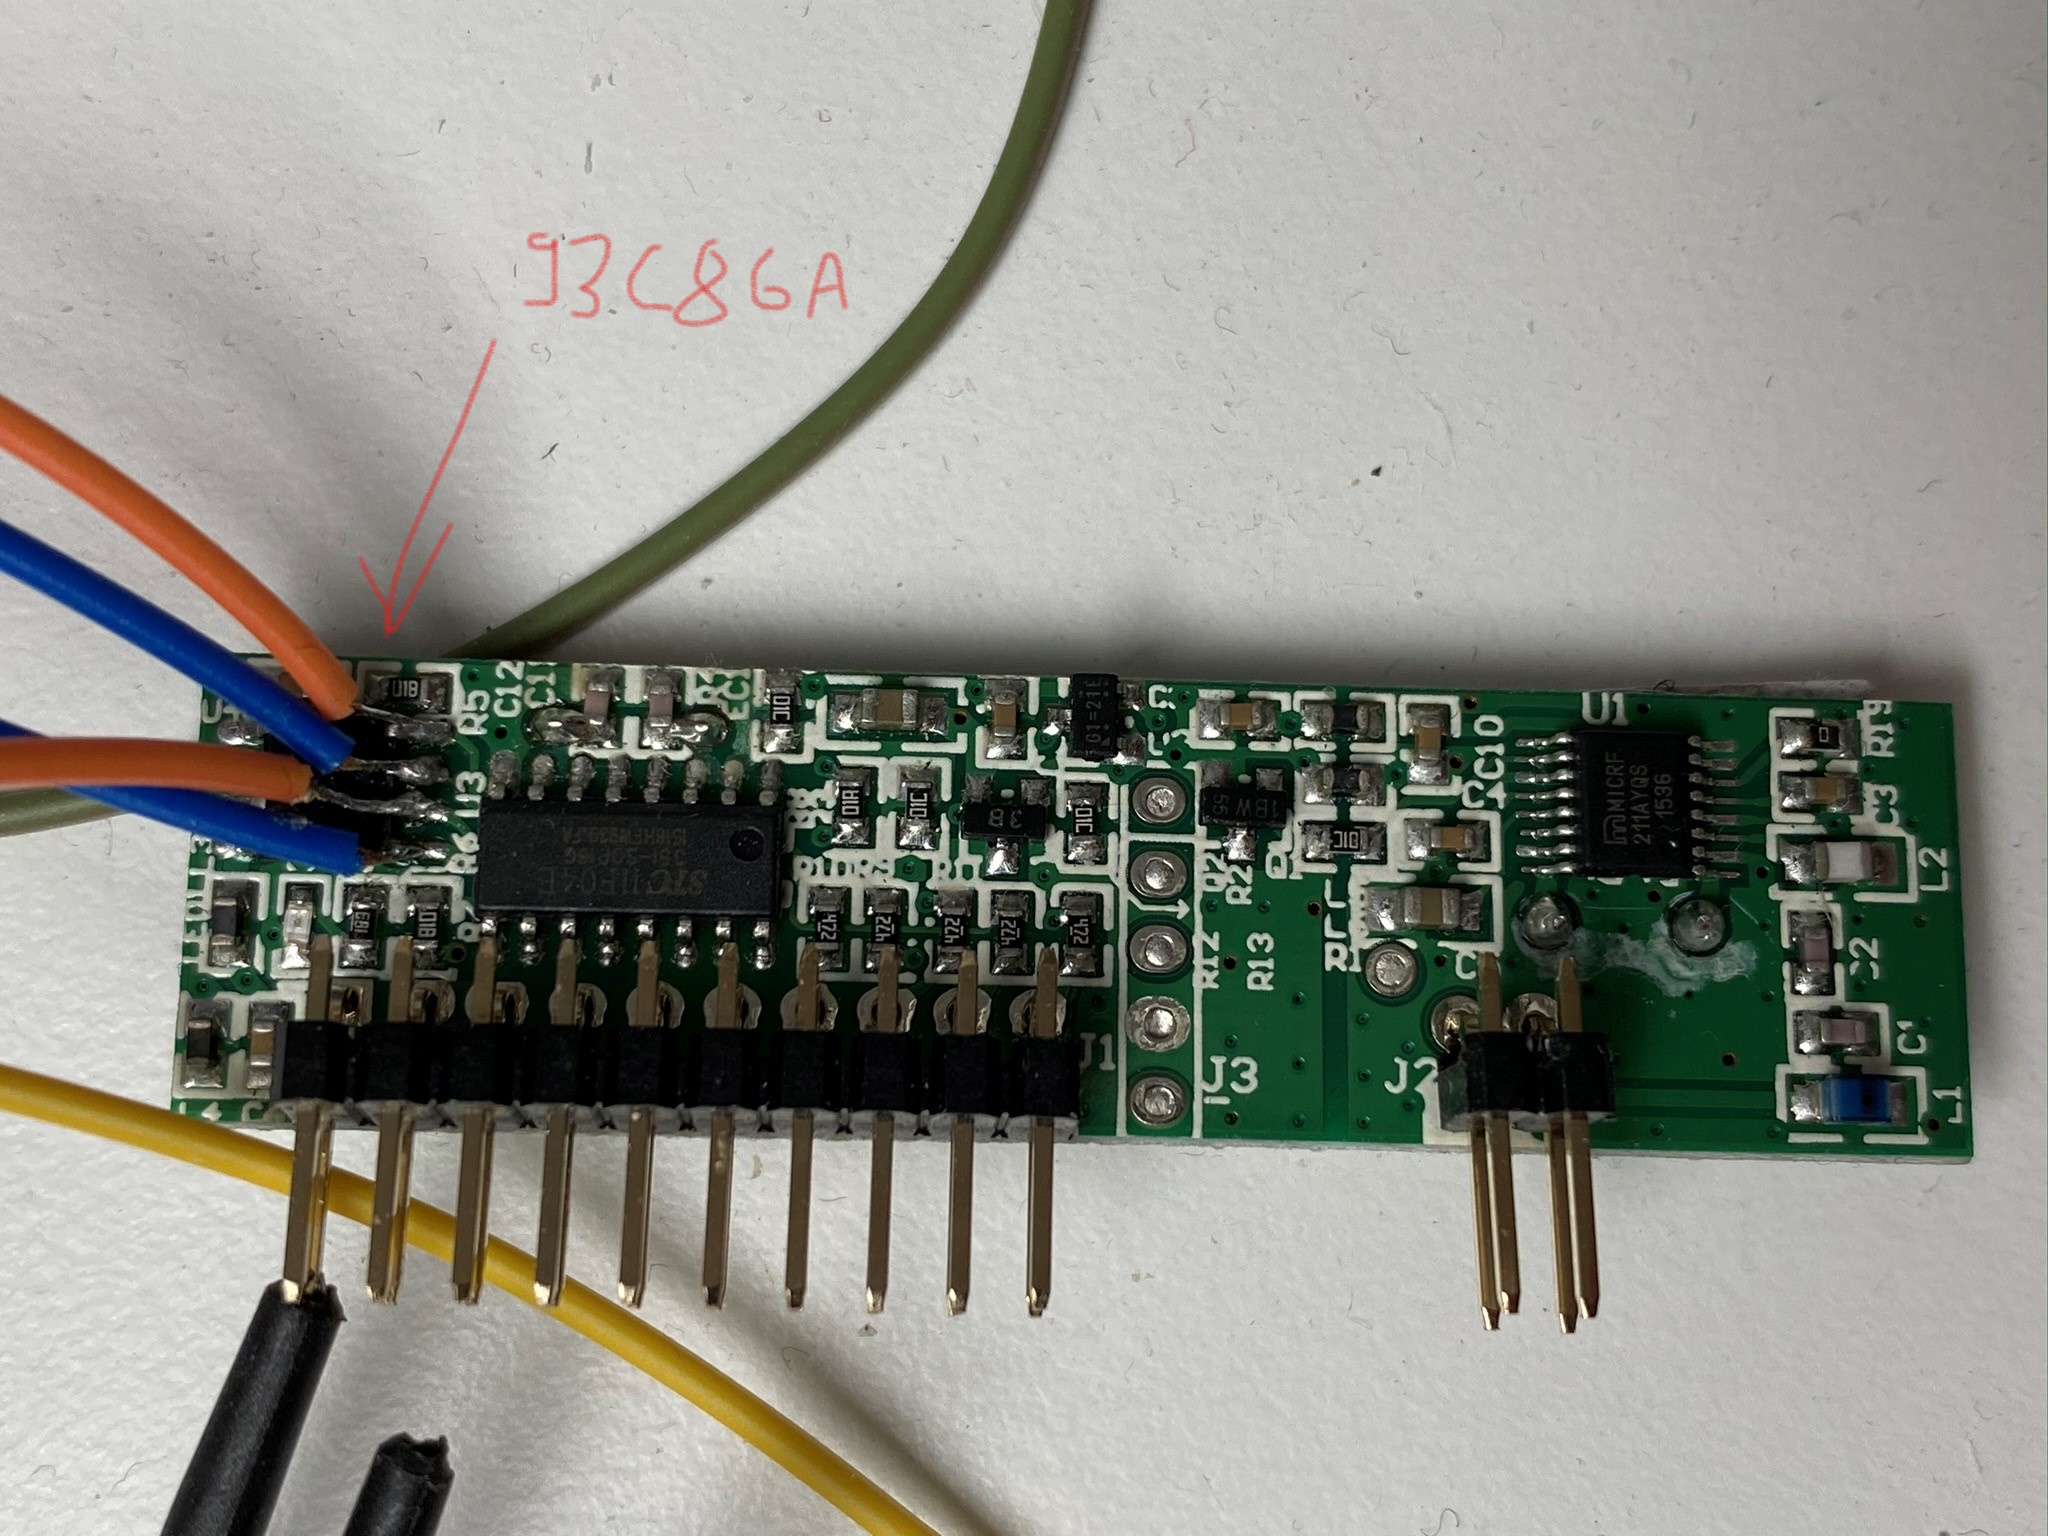
my overall plan is to analyze the remote control for my garage door, that is using the keeloq algorithm. So the attack will use the cipher output only.

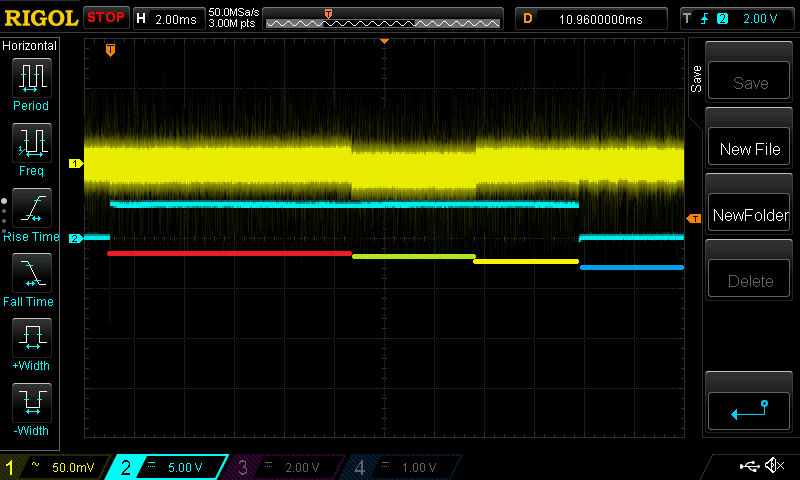
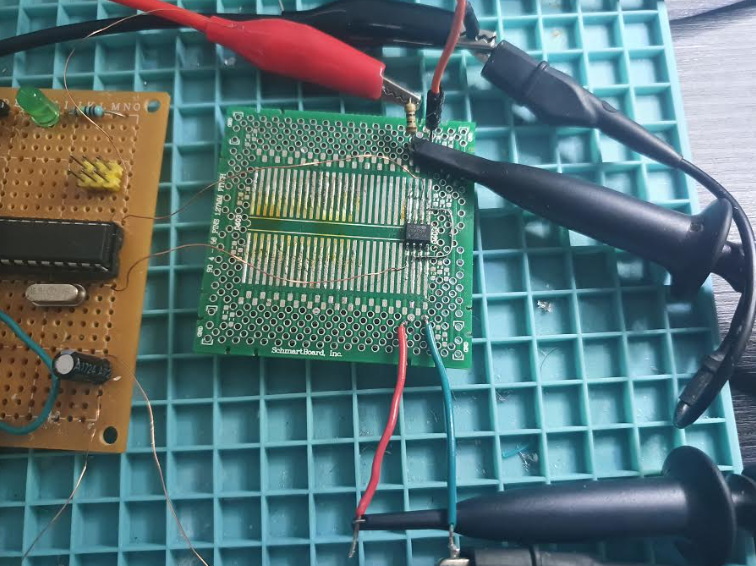
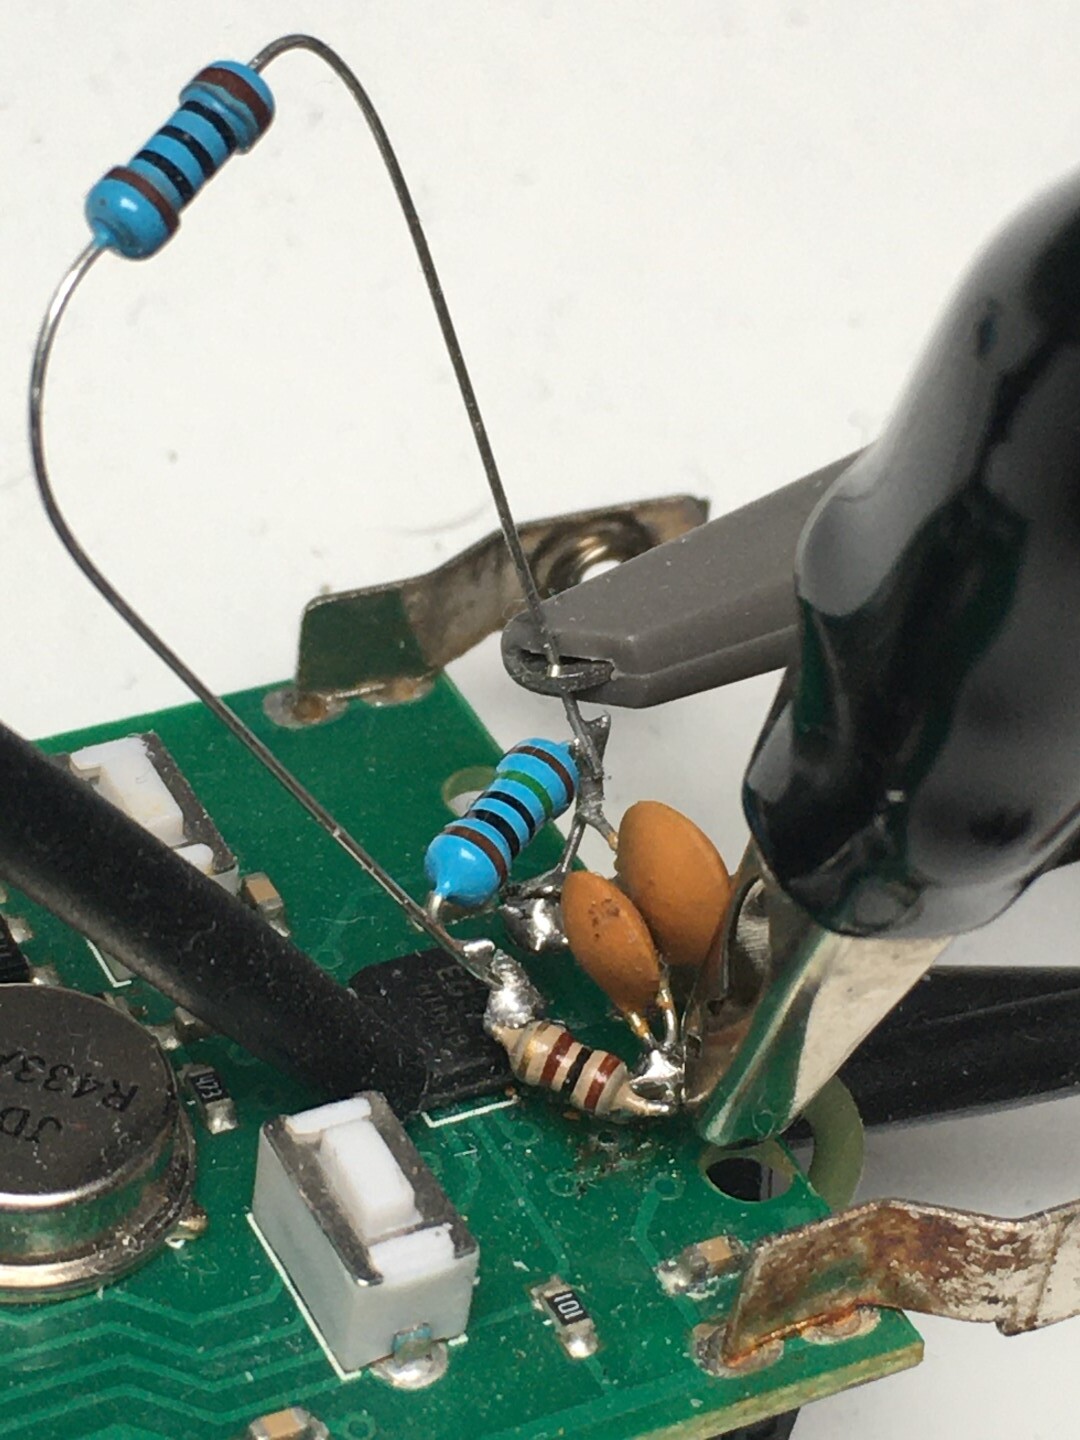
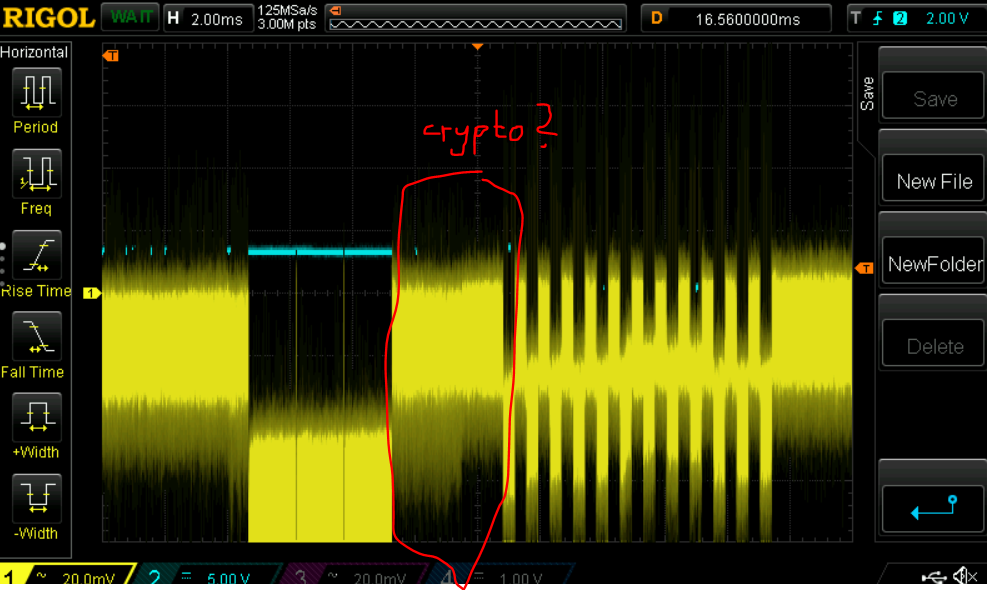
For this, I am using the cwnano at the maximum sampling rate (30Msps) and added some trigger offset in the ATSAM firmware to start sampling at specific points in time after “pressing” the remote control button using the cwnano’s GPIO4.

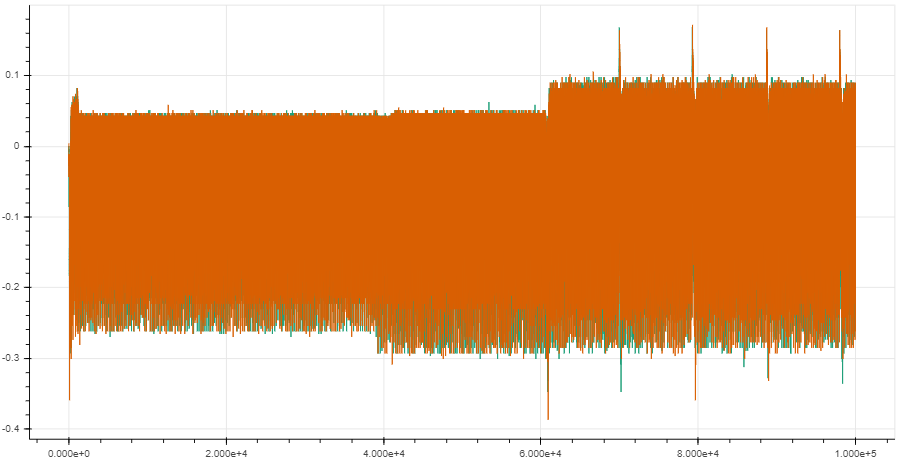
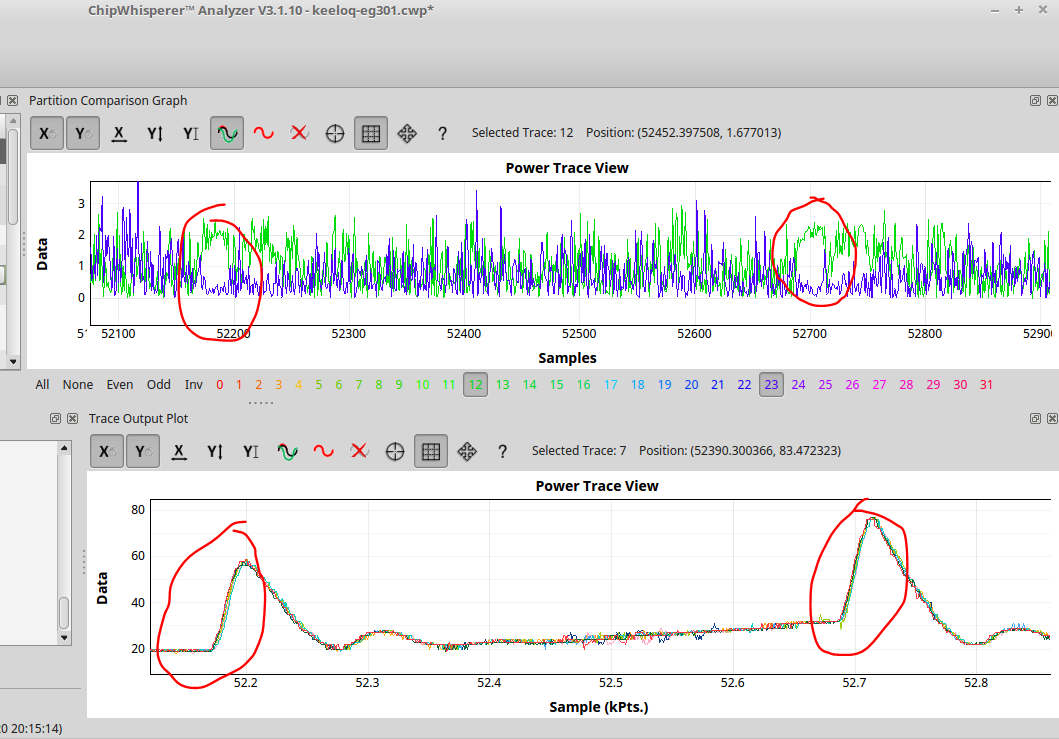
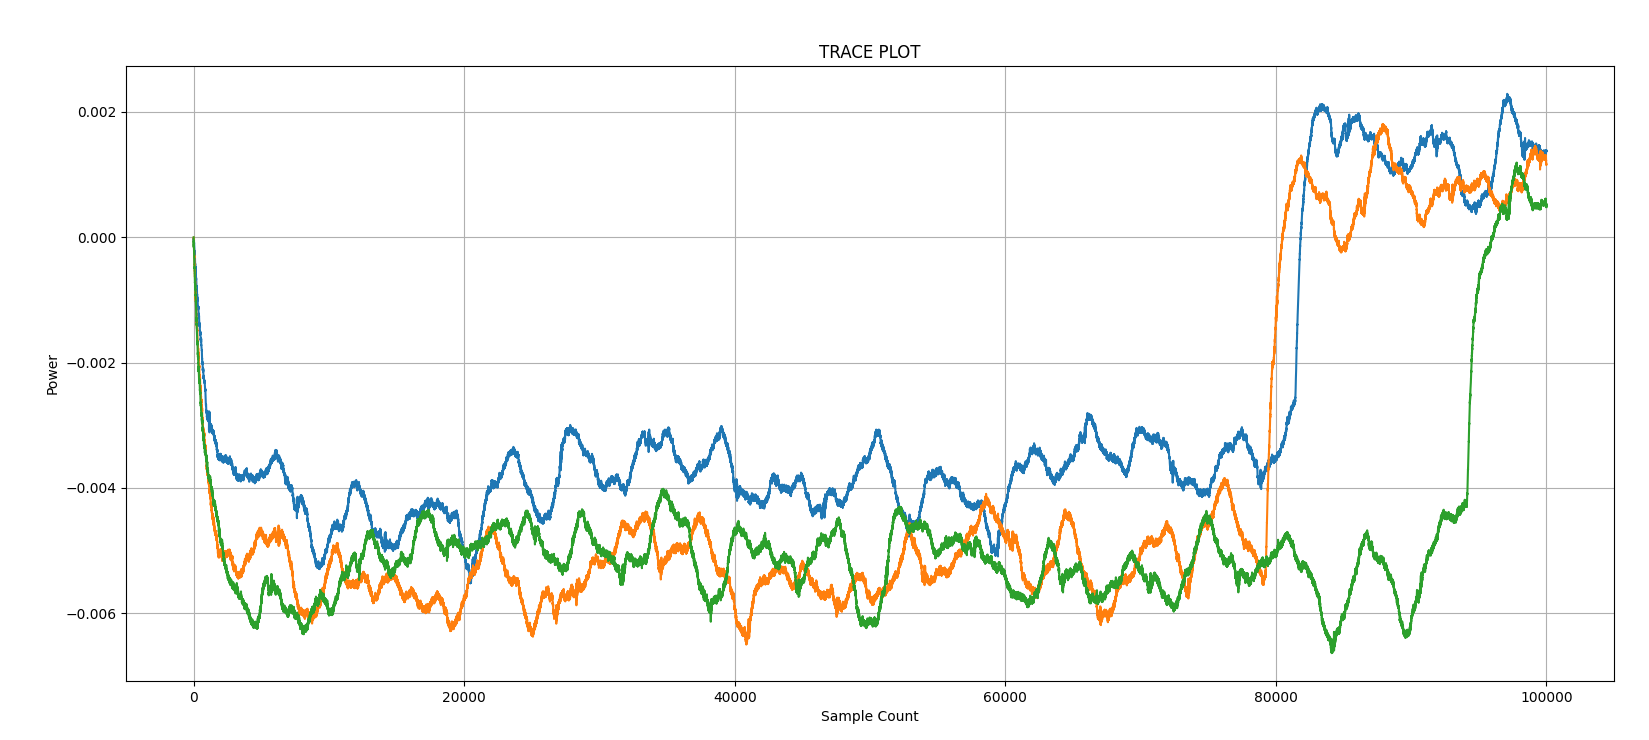
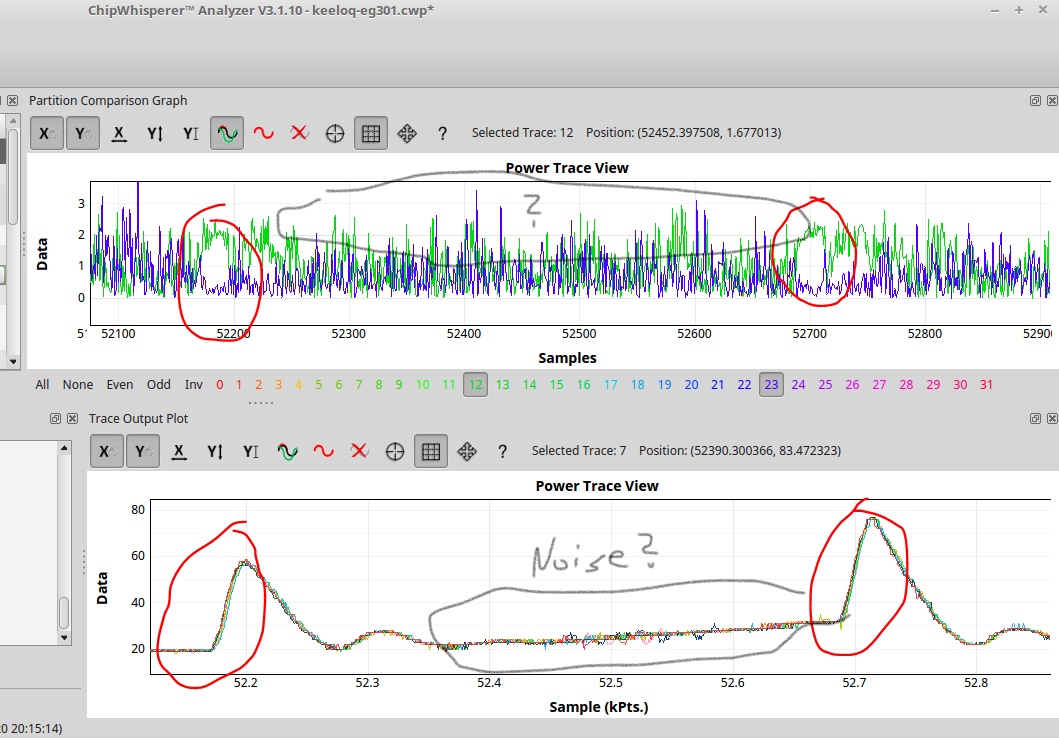
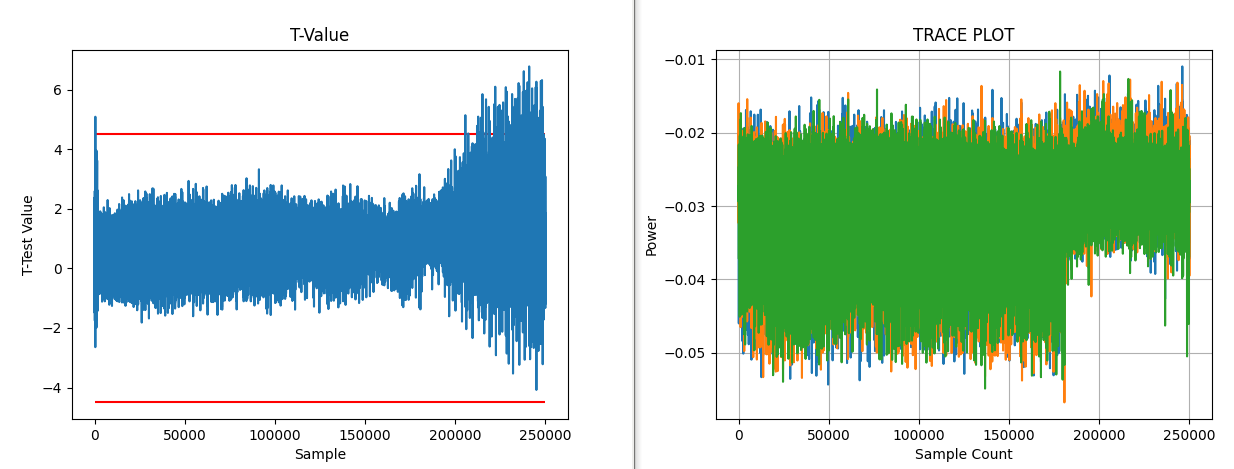
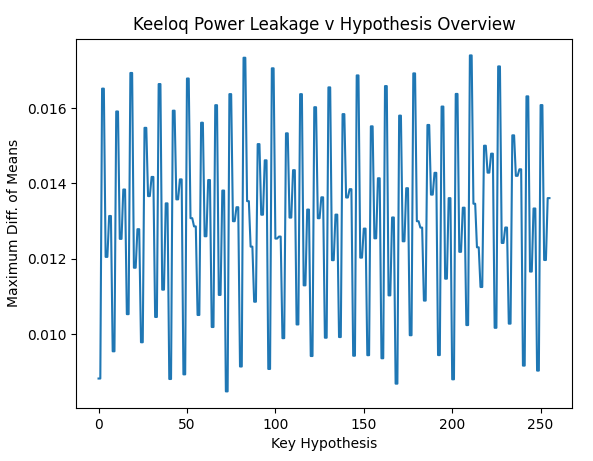
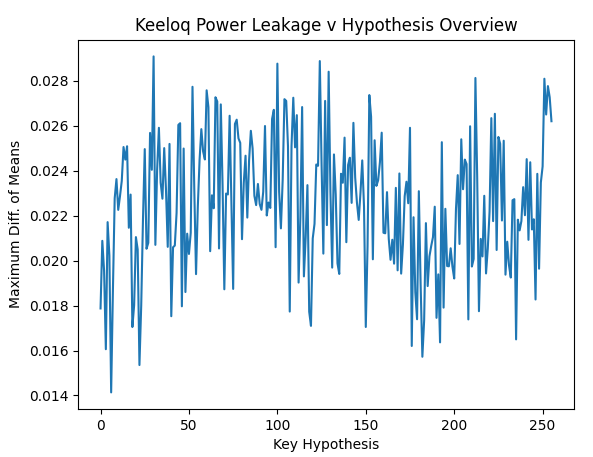
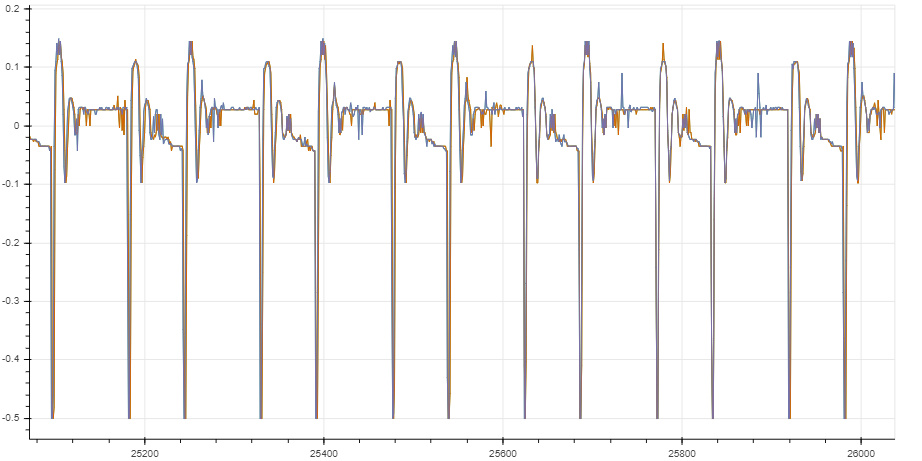
I have recorded 200 traces with 40k samples each. From pressing the button until the first rf pulse, >16 ms elapse, so I tried at two different offsets and want to see any correlation with the encrypted output. For other examples, I saw these rainbow color spikes, showing the sample positions where the 32 bits leak.

But so far my eyes see no rainbow colors :frowning:

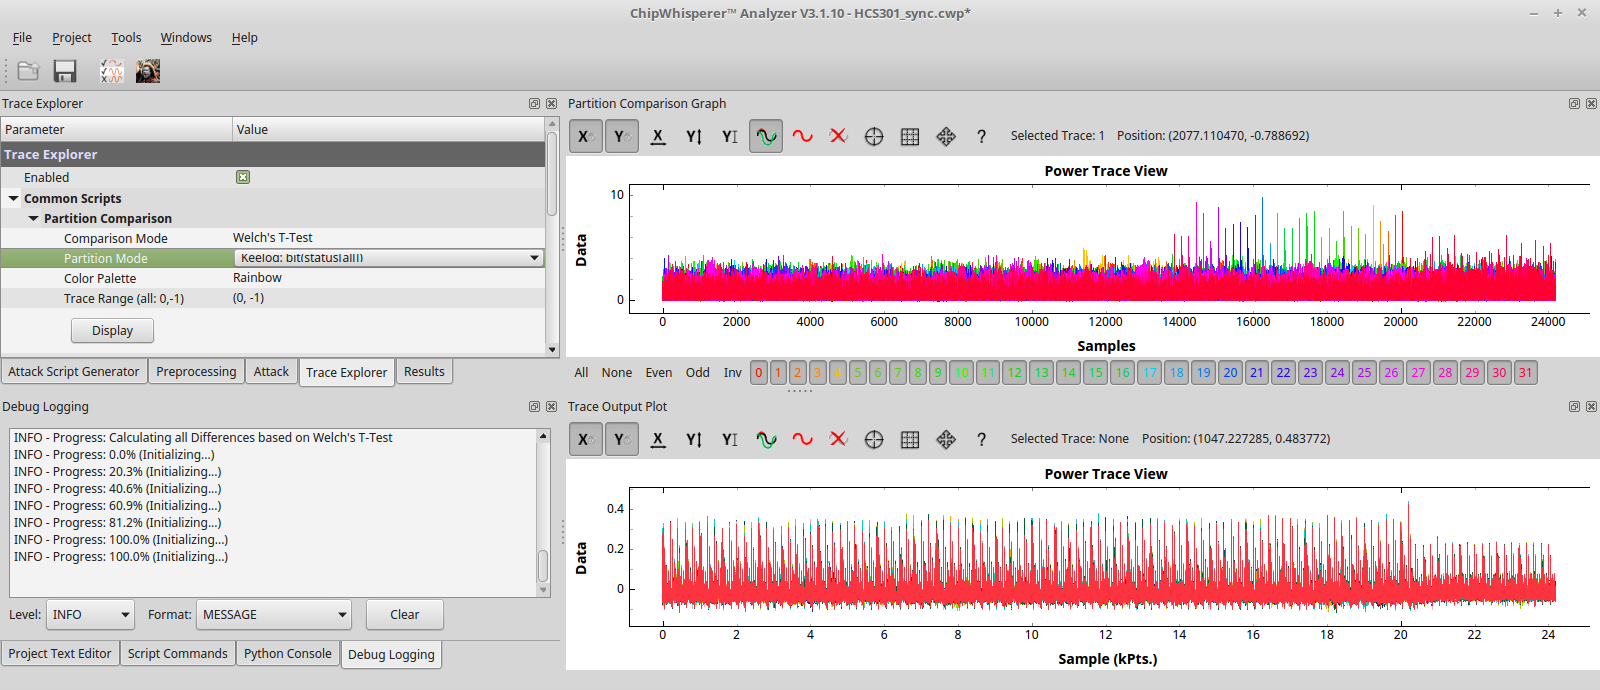
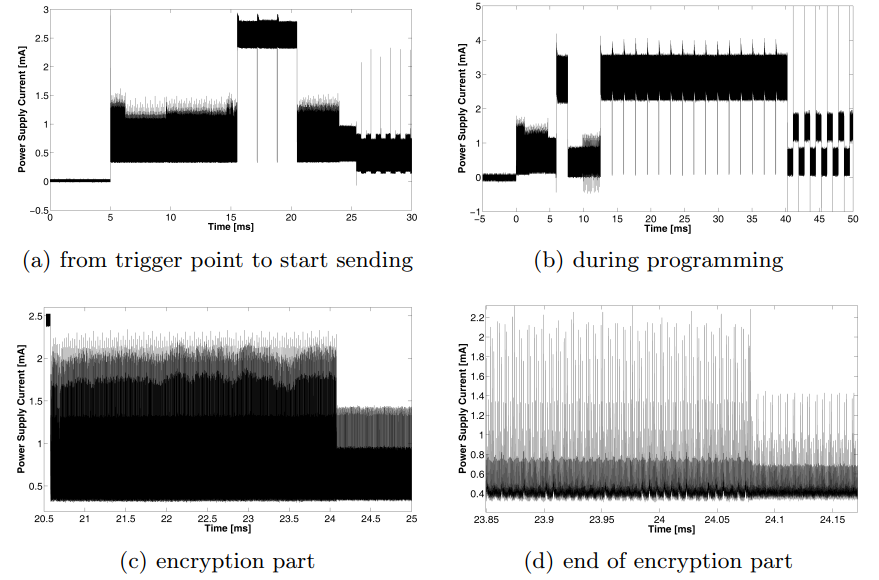
So I compare my situation to what this guy in 2016 did: chipwhisperer-marc/doc/marc/keeloq/examples_hcs301/examples_hcs301.md at master · marc-invalid/chipwhisperer-marc · GitHub
48Msps using the CW1002
The chip analysed there was the original microchip HCS301, runnint at ca. 1MHz
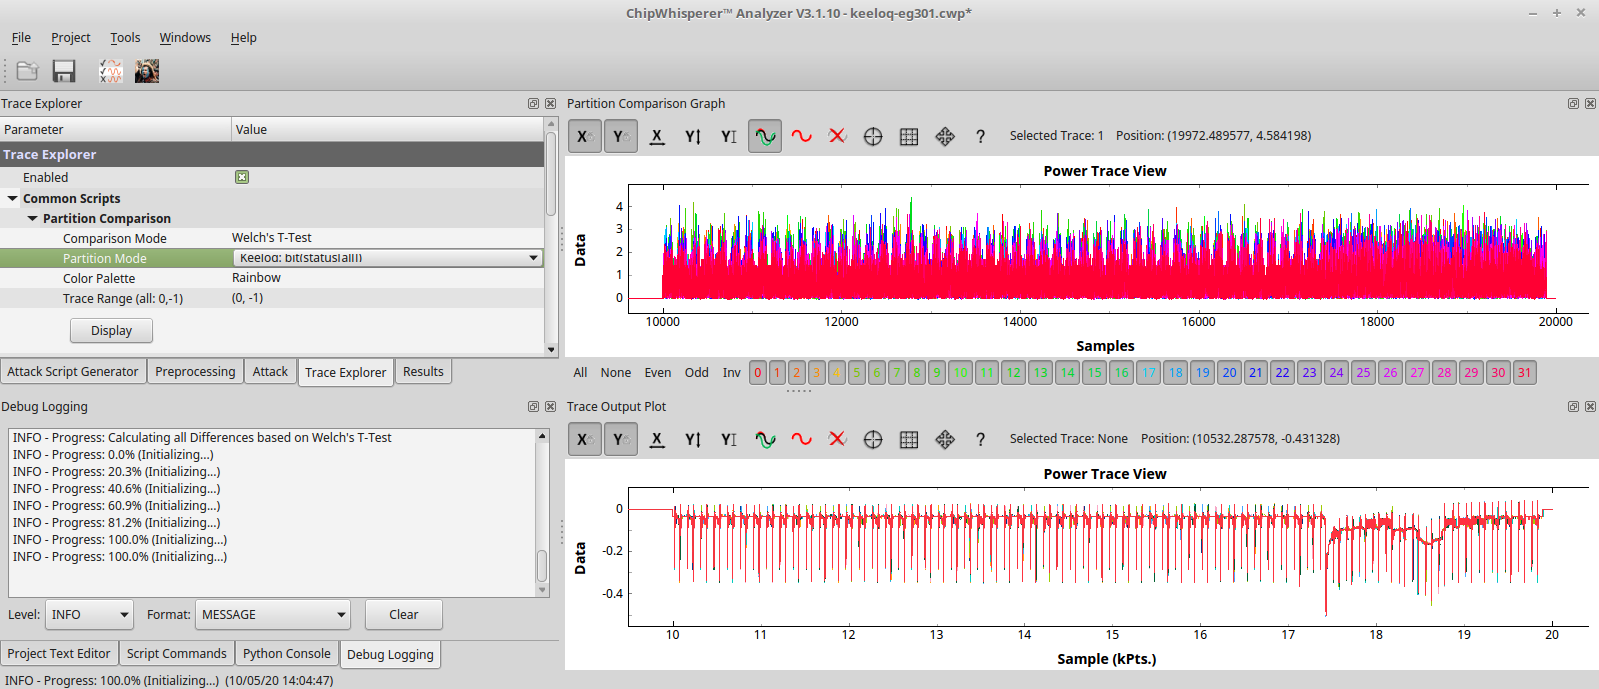
I am analyzing the EG301, a chinese clone: EG301 pdf, EG301 Description, EG301 Datasheet, EG301 view ::: ALLDATASHEET :::

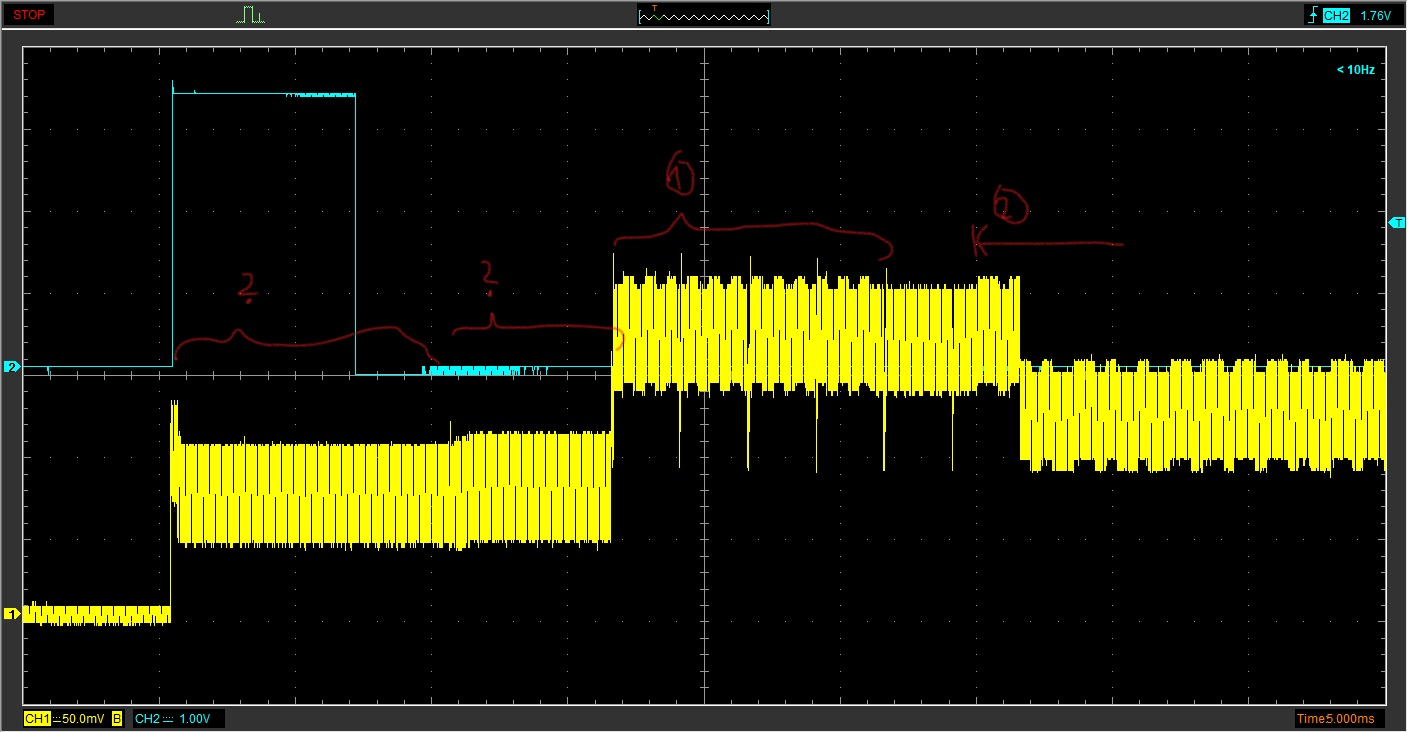
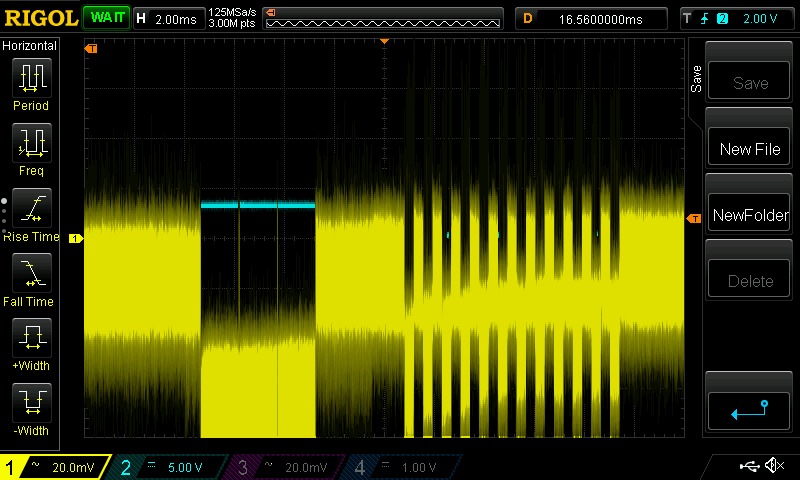
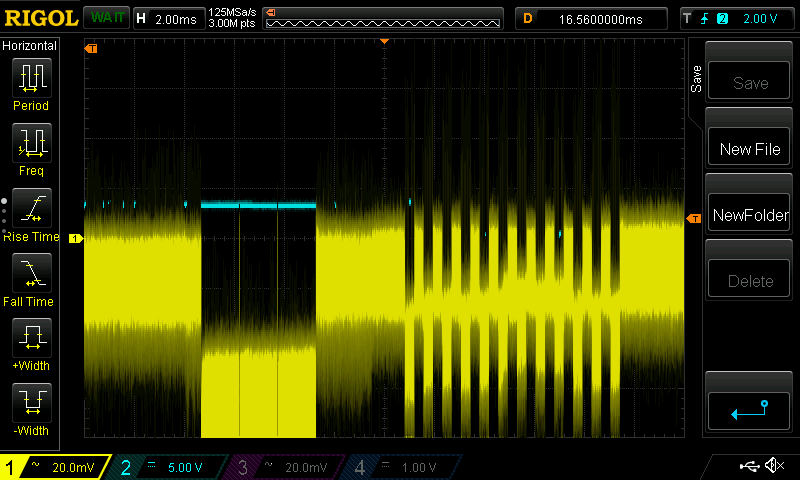
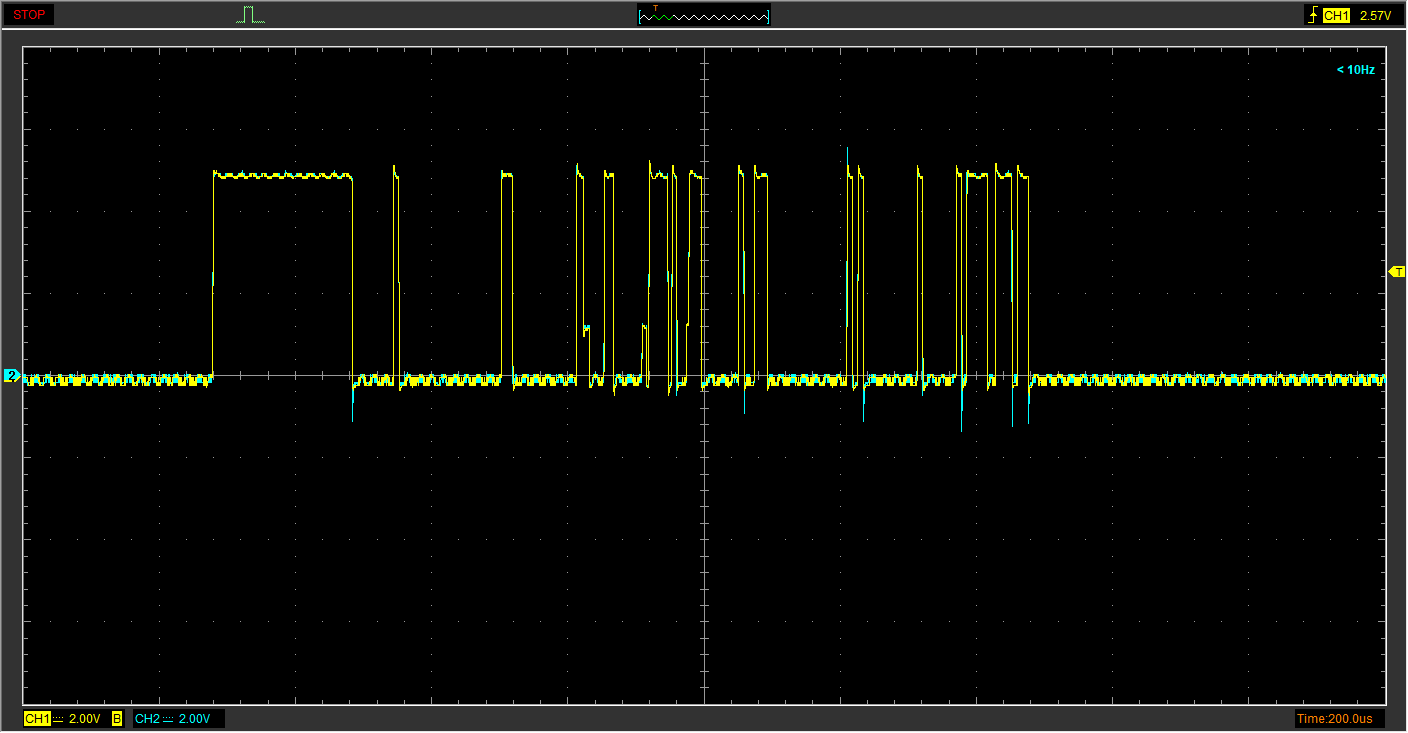
Also my power trace shows two clocks spikes fast, followed by little pause (2 clocks pe instruction?). Whereas the HCS301 shows four spikes going down (four clocks per instr.?).

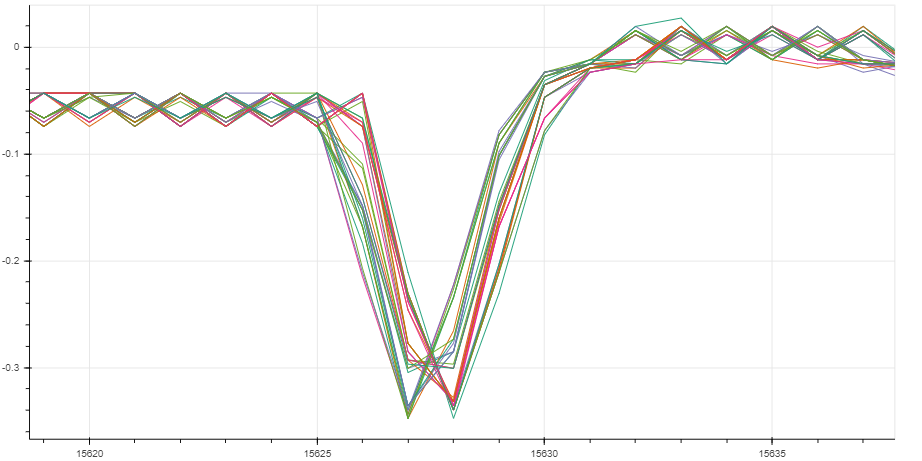
Anyhow, the HCS seems to leak the bits at the second largest spike (out of the four).
This was kind of surprising to me today, since I was about to consider the maximums only.

What next?

  • Does my powertrace look usable with respect to sampling frequency/resolution?
  • Are some counteremeasures known, that might be implemented in this chip released in 2013?
  • Any hints, how to find the leaking samples when only the textout is known?

Regards,
Henning

Hello everyone,

I am still experimenting in finding the leaking bit positions. Let me show my current findings, maybe someone can comment on this.

First, I recorded a trace of the power consumtion, triggered by the remote control button. Settings: 3Msps, 100.000 samples:

My interpretation/assumtion of this trace:

  • 0-40k: busy wait loop for timing, since it is the lowest power consumtion.
  • 40k-60k: encryption/ keeloq algorithm (528 rounds (=instructions?)) calculating the encrypted portion to be sent.
  • 60k-100k: eeprom/flash writing, highest power consumtion with remarkable spikes.

So I recorded 200 traces at 30Msps, 20k samples at the end of the suspected encryption.

… continued:

Since the encoder chip uses an internal rc oscillation, I have considerable clock drift.

My preprocessing is:

resync_traces = cwa.preprocessing.ResyncSAD(project)
resync_traces.ref_trace = 0

resync_traces.target_window = (17200, 17800)
resync_traces.max_shift = 400

This is fine for the target Windows, but I am still observing some minimal drift in the preceeding encryption rounds. So, second, I apply this SliceToSlot preprocessing: chipwhisperer-marc/software/chipwhisperer/analyzer/preprocessing/resync_slice_to_slot.py at master · marc-invalid/chipwhisperer-marc · GitHub

This apparently fixes the drift.
I saved these preprocessed traces to csv and imported them in a CW4 VM, using the keeloq patitioning to see the instructions leaking the status register bits.

In the powertrace view, you can see the instructions before the suspected flash writing occured at samples >17400.

Unfortunately the Partition Comparision does not reveal where the bits are leaking?

Any idea, where the issue is?

Best regards,
Henning

just for reference, what I expected to find using the Keeloq Partitioning: the lined up rainbow spikes, that are visible when processing the sample traces:

My assumtion is, the leaking bits are not visible, because the measuring was not precise enough. Therefore I increased the number of traces to 800. For preprocessing means, I also apply the SAD for filtering out the worst 50 traces. Then, resync, then slice-to-slow, and finally filtering out the worst ca. 50 traces, leading to around 700 good traces.
Anyhow, the rainbow spikes are still not visible.
looking at one of the preprocessed spikes in details shows the following:

The peaks are of only one sample. So the spikes are really narrow, and the 30Msps samplingrate might not be enough. Because of the CWNANO’S hardware limitations, I need to find another way to get the spikes with more detail.

My idea is, to put a little capacitor in parallel to the measuring amplifier input.
This should spread the spike over more samples, so I can measure the power consumtion for each mcu cycle more accurately.
Any comments on this idea?

regards,
Henning

Hi Henning,

I don’t think this would work, since you’re just filtering those higher frequencies out, not shifting them. I’m not sure how much you can really do to work around this limit, short of just using a device with a higher sampling rate.

Alex

Here is my update.

I captured traces with a more decent scope at 125 MSa/s. No rainbow. :frowning:

Now, with that scope I made another more detailed overview trace, to decide about the interesting point to trace with higher resolution later.

Here my findings:

(1): The rf transmission with 12 sync pulses for gain control starts.
(2): You can see the encrypted bits start here.

Conclusion:

  1. RF sending overlaps with EEPROM operation. Maybe its done timer/interrupt based?
  2. It the CPU is idle during (1), there might also happen the encryption, that will be finished when reaching (2). I have doubts about this, but it might be possible based on my current knowledge. Comments?

What about the ? parts?

I captured 100 traces (with really precise peaks, well aligned) at the end of those areas, but no correlation in the charts.

According to this paper: https://www.emsec.ruhr-uni-bochum.de/media/crypto/attachments/files/2010/04/crypto2008_keeloq.pdf
30 traces at 200MSa/s for the SO8 package, or 60 traces at 50MSa/s for the DIP are enough for recovering the key.

Even if the 100 traces I have might not recover the complete key, should not I at least see the correlation via the rainbow bars? Or will it behave like binary, all or nothin?

Comments? Any idea what to do next?

Henning

Hi,

meanwhile I recorded 1000 traces with 64000k samples each at 50MSa/s at the end of the above’s second questionmark position.

However, the partitioning still does not reveal the rainbow colors as lined up spikes.

But, what I can see now is a repeated correlation on the rising an falling edge for every instruction (both clocks show correlation with the same bit).

The corresponding bits for some positions in time that I manually analysed are:

Pos. Bits
16800 2
18040 19
19280 26
20520 14
21760 1
23000 13
24230 10
25460 5
26700 30
27940 27
29180 3
30420 18
31660 14
32900 16
34130 28
35370 11
36600 23
37840 25
39080 13
40320 4
41560 21
42800 16
44030 29
45270 22
46510 18
47750 24
48990 24
50220 14
51460 26
52700 11
53940
55175 24

Interpretation

  • Most bits appear to have distingishable correlation somewhere within my traces, except i.e. bit 6 that is missing. But it might be found before I started recording the trace.

  • Only few duplicates, i.e. Bit 24. Might be because of distorted data or noise, or my fault in reading the values.

  • Correlation does not cause outstanding spikes. This makes the automatic search for POIs fail, if i understand the dpa algorithm correctly, since the position of interrest for each bit is found in the trace by the max value in the correlation data. Not sure how to deal with this issue.

  • The occurence in the timeline does not reflect the number of the bit (not sorted).

What might be the reason for the missing order?
Idea: The recorded samples are some rounds before the end, so because of the NLF the correlated bits are not yet at the final position. Sampling at a later point in time should be better. Will have to see how to trigger the scope there, since it will overlap with the eeprom write.

Why are there no outstanding spikes in the correlation graph?
Idea1: Random noise pulls too much attention, so the leaking points in time are covered.
Idea2: The correlation is found on the edges, not at the peaks. Peaks are somehow identical for all rounds/traces. This might affect also the correlation graph showing no real peaks.

Please comment on my thoughts.

Henning

Another thought about the observed architecture: Other MCUs and the HCS301 seem to implement a MISC architecture without pipelining. Each instruction is split into four stages. This shows four spikes per instruction, all with different power consumption. The second stage leaks the key.

Since the EG301 shows only two spikes: What kind of architecture might this be? Can MISC be implemented with only two stages? Or is this controller using a 4->2 pipelining, so that two stages are running in parallel?

Might this be relevant for the applied leakage model?

regards,
Henning

Cool post, thankyou for sharing this - I’ve started looking at an HCS301 chip. I get a significantly different overview trace than yours, maybe this can help narrow down the areas of interest, even if we’re looking at slightly different targets (but I’m guessing the core cryptoraphic block is the same):

Note that there’s a wait betwen what looks like crypto time and RF time that’s not present in yours - though that might just be down to an implementation difference.

I found that the time desync between traces was quite large (250MSps, low-pass 60khz):

In cases like this, sometimes, I’ve sometimes found it’s useful to do a two-stage resynchronisation, once using a low-pass, and then again (with a smaller maximum window), to avoid the problem of “fake alignment” due to noise spikes being aligned, particularly with small windows).

That said, if you’ve manually identified correlation points - does Welch’s t-test show spikes (for any one bit of the output/ciphertext)? I haven’t managed to identify some points of interest yet (suspect noise), but will post an update when I manage it.

Thanks for sharing your research on this!

regarding the resync/alignment: I also had hard times with this. My latest preprocessing was: finding a significant spike that is unique in the traces, set this for the reference window for the SAD resync, then fine tune using the the mentioned slot-to-slice peak detection for aligning each clock period according to the maximum peak. For this I ported the mentioned CW analyzer 3 preprocessing code to CW version 5. This solves all sync issues for my setup. No fake alignments or skipped clocks. Anyhow, I suspect the EG301 chip to insert some random instructions to mess up the DPA. So the unique spikes might be timer based and irrelevant for the encryption instructions and therefore destroy my analysis.

Regarding the Welch-T test: The correlation after this test is shown in the upper graph of the CW 3 analyzer screenshot. This was the input for the manual identification. Unfortunately no significant spikes are visible for the status register bits. I am still not sure what causes these lower correlation spots.

Also, I don’t understand how it is possible that with 1000 traces there is so much noise in the correlation graph (Welch-T test). I expected that if that is caused by noise in the captured signal, the might have been polished out with inceasing number of traces processed. But there is no visual difference between 100 or 1000 traces processed. The noise is the same.

One more thing: what is the exact rigol scope model you are using? 3M pts storage sounds good. :slight_smile:

I am still experimenting with 64k storage depth. Or 32k when using the sencond channel for triggering. For analysis this is enough, but setting the trigger right to have a unique spot is sometimes hard. Some more storage would be comfortably.

Did you find out the relevant time in the overview trace? For the HCS301 you should find the encryption here:

https://www.researchgate.net/publication/220335824_Physical_Cryptanalysis_of_KeeLoq_Code_Hopping_Applications

And finally: Looking at your three traces (green, orange and blue): There seems to be considerable noise. In my setup there is way less noise. This might be a problem for the analysis. How did you connect the probe?

I’m using a DS1104Z, connected as thus:

(Single probe connected to a 10 ohm shunt on vcc, no decoupling)

I haven’t managed to identify the crypto block - I followed the 2008 paper to start with, it looks like there’s been some implementation change since then, as the entire trace until the first RF pulse is only ~20ms. Agree about the noise thing, I’ll have a go at cleaning it up - do you have any tips for how to get a cleaner trace / would you mind sharing your setup as well?

The HCS301 should be running fine with a 100 Ohm resistor. This will produce a higher voltage and less noise.

The EG301 stops sending the RF when using a resistor > 150 Ohm, but the encryption finishes.

Here is my “bench”:

The resistor armada is not required, but I was a bit lazy to replace them, once I found a value with appropriate peak to peak voltage. Also those two capacitors to ground seem to have no effect on the measured signal. So I don’t recommend adding them. I will clean this up at some time.

The logic analyzer is used with my sigrok keeloq decoder, so I get the cypher-text into chipwhisperer.

For triggering, I was testing two alternatives: 1.:Triggering by voltage on the first channel. This is easy but inflexible, it allows at least to capture the trace just before eeprom write and I get 64k pts when using only one channel.
The second approach is: using the cwnano to be triggered when the remote “button” is pressed, add some delay given in micro seconds, then trigger the scope using the second channel using the cwnano gpio output. This allows capturing any time slot, but only 32k pts.

The device under test is a “real” remote control. My children keep dipping them into water, so my plan is to make a clone, once I get the key. Or control the gate via home assistant.

Thanks, changing the shunt resistor (2x47 Ohm, 5v supply) did help, but I did need to filter the power supply (via the LC filter on https://wiki.newae.com/CW308_UFO_Target) to remove remaining noise, which would otherwise be hidden in the traces, as below:

(Also, I wonder if the other components on your target board are affecting the power measurement?)

Here’s where it gets a bit wierd though - after software filtering and aligning the traces, I did a t-test on the last bit of ciphertext. I’ve found strong correlation, on the last bit only - and from what I can see, past the end of the crypto operation (the t-test spike at the start of the trace is a false positive, created by the alignment process).

Not sure if this helps at all - truth told, I’m a bit puzzled by this result (are you getting the same, for any bits?). I’ll keep studying the algorithm and reading code, let’s see where it goes.

Very interesting!

On which part of the traces did you run this correlation analysis?

At least your power trace now looks exactly like in the 2008 paper.

How did you run the analysis in CW 5? I did not have a look at the CW5 python analysis code, to adapt it for the keeloq data.
How did you incorporate the ciphertext into the cw project?

One of my problems is still that I export my traces and textouts to csv and import it in a linux VM in CW3, whicht takes more time than the capturing itself. So I’d be glad to run some analysis in CW5 directly after capturing and preprocessing.

Cheers
Henning

You’ve highlighted the part where I’m running analysis against - I’m targetting the area between the two blocks you’ve pointed out, as the analysis (both sanity check vs ciphertext and key recovery) both seem to just need the last few rounds.

For the analysis itself, I’m using some duct-tape Python (for reference: GitHub - CreateRemoteThread/sparkgap: Combined SCA / FI Framework), but I found loading inputs into ChipWhisperer format is fairly straightforward if everything is in numpy arrays. If you’ve got a spare Arduino-compatible board handy, this might help (you should be able to stick this in front of the CW as a “driver” - just send any byte over 115200 8n1 uart to trigger encryption read back the keeloq output as a bit string, may need to adjust pwm timing for your target):

hcs301.zip (782 Bytes)

I’ve done some further investigation and may have made progress. Specifically, I think we can simply ignore the fact that we can’t find the ciphertext location, and perform CPA against the hamming distance over the round-to-round state change for per bit of the key.

To confirm my theory, I’ve taken 3 independent (I mean really independent, all three used different resistors, one was a VCC shunt and two were ground shunts, timing and vertical alignment are eyeball-level accuracy) trace sets at 125MSPS towards the end of the crypto block identified in the 2008 paper. A two-pass SAD alignment was applied, with no further noise removal.

As the correlation peak for a single bit of the key would be difficult to distinguish from noise, I did 8 bits of the key at once, and ran the test against all three of my trace sets. The results are below:

I then took it a bit further, testing the next 8 bits of the key:

And the next 8 after that:

I’d take screenshots for the next round, but it’s frustratingly slow at this point due to the lack of caching for the Keeloq decrypt-with-known-bits operation. The next round has all three trace sets agreeing on the next key byte, 0xbf.

In comparison, DPA performed poorly for me.

Exhibit 1, against an intermediate value’s last bit (think this is caused by the way I’ve split the key into chunks for processing):

image

Exhibit 2, against the hamming distance of an intermediate value (unlike CPA, none of the traces agree):

image

I believe this is due to vertical noise - in the chipwhisperer-marc example, the leakage looks like it was amplified to 300mV-400mV (looking at the raw numpy, assume cw3 measured in volts), but the actual DPA was something like 20mV from memory - which can easily be drowned out.

I note that couldn’t find many test traces for hardware Keeloq, so please find mine at acorn stash – Google Drive, incase they’re useful to you / future readers, you can convert them to ChipWhisperer format pretty easily with a cwp file and a cfg file to define the trace set.

I’d argue this is at least initially indicative that it is possible to go for the key, despite our inability to locate the ciphertext via t-testing each bit. (To anyone reading this: are there other cases where this happens?)

I’ll continue following this rabbit-hole, but perhaps this provides an alternative way to approach your target?

Hi,
to be honest, I am not sure what to read from your charts. Shouldn’t it be easy to produce traces just as those found in the chipwhisperer-marc repo, and perform the same analysis using the cw3 version? At least this is what I am following now.
Today I got a pair of HCS301 based remotes from china, plus a two channel receiver. I will start tomorrow to record some traces and check my analysis workflow is correct for the original microchip encoder. The next step will be to replace the receiver board included in the gate/door drive with that china equipment (family still needs to operate that door) and start a SPA on the included receiver board once I have it on my desk.

Regards
Henning

Here is my update:

I have replaced the receiver board in the door drive with the HCS301 FOB kit, so that I can analyze the original receiver board on my desk.

Here it is:

The MCU is a STC11F04E Accoring to the datasheet, it includes 2k of eeprom.
But the board includes an additional serial eeprom: Atmel 93C86A.

What is that used for? Are the keys or counter values stored in it plain text?

I soldered some wires to the microwire interface: CS, SK, DI, DO. Using sigrok and a logic analyzer, my plan was to make the data visible. But the result was disappointing:
The measured signals are invalid from the protocol decoder’s perspective: no operation/address/data shown. DI and DO show identical signal, measuring shows, they are coupled with 1kOhm. The clock is anything but steady. I have no idea what this operation mode means.
Attaching the scope shows that DI and DO have some intermediate state.


Hardwaredesign seems messed up? Maybe there are more initialization steps required to make it operate properly. In my test setup, there is only 5v and gnd connected. I will compare it with what the mainboard does.

When can I see the serial communication with this eeprom?
When sending valid codes to the receiver, no eeprom communication is observed,
But when set to learning mode, the eeprom lines are operated.

Interpretation:

  • The rolling code counter values are not stored in the eeprom, or at least not after every valid command the receiver deodes.
  • The serial numbers of learned FOBs might be stored in the serial eeprom.

I have no idea why they are doing this. Maybe the atmel eeprom is more relible, the datasheet indicated 100 years data retention and 1M write cycles. But if that’s the reason, why is the counter value not stored in it?