Hello,
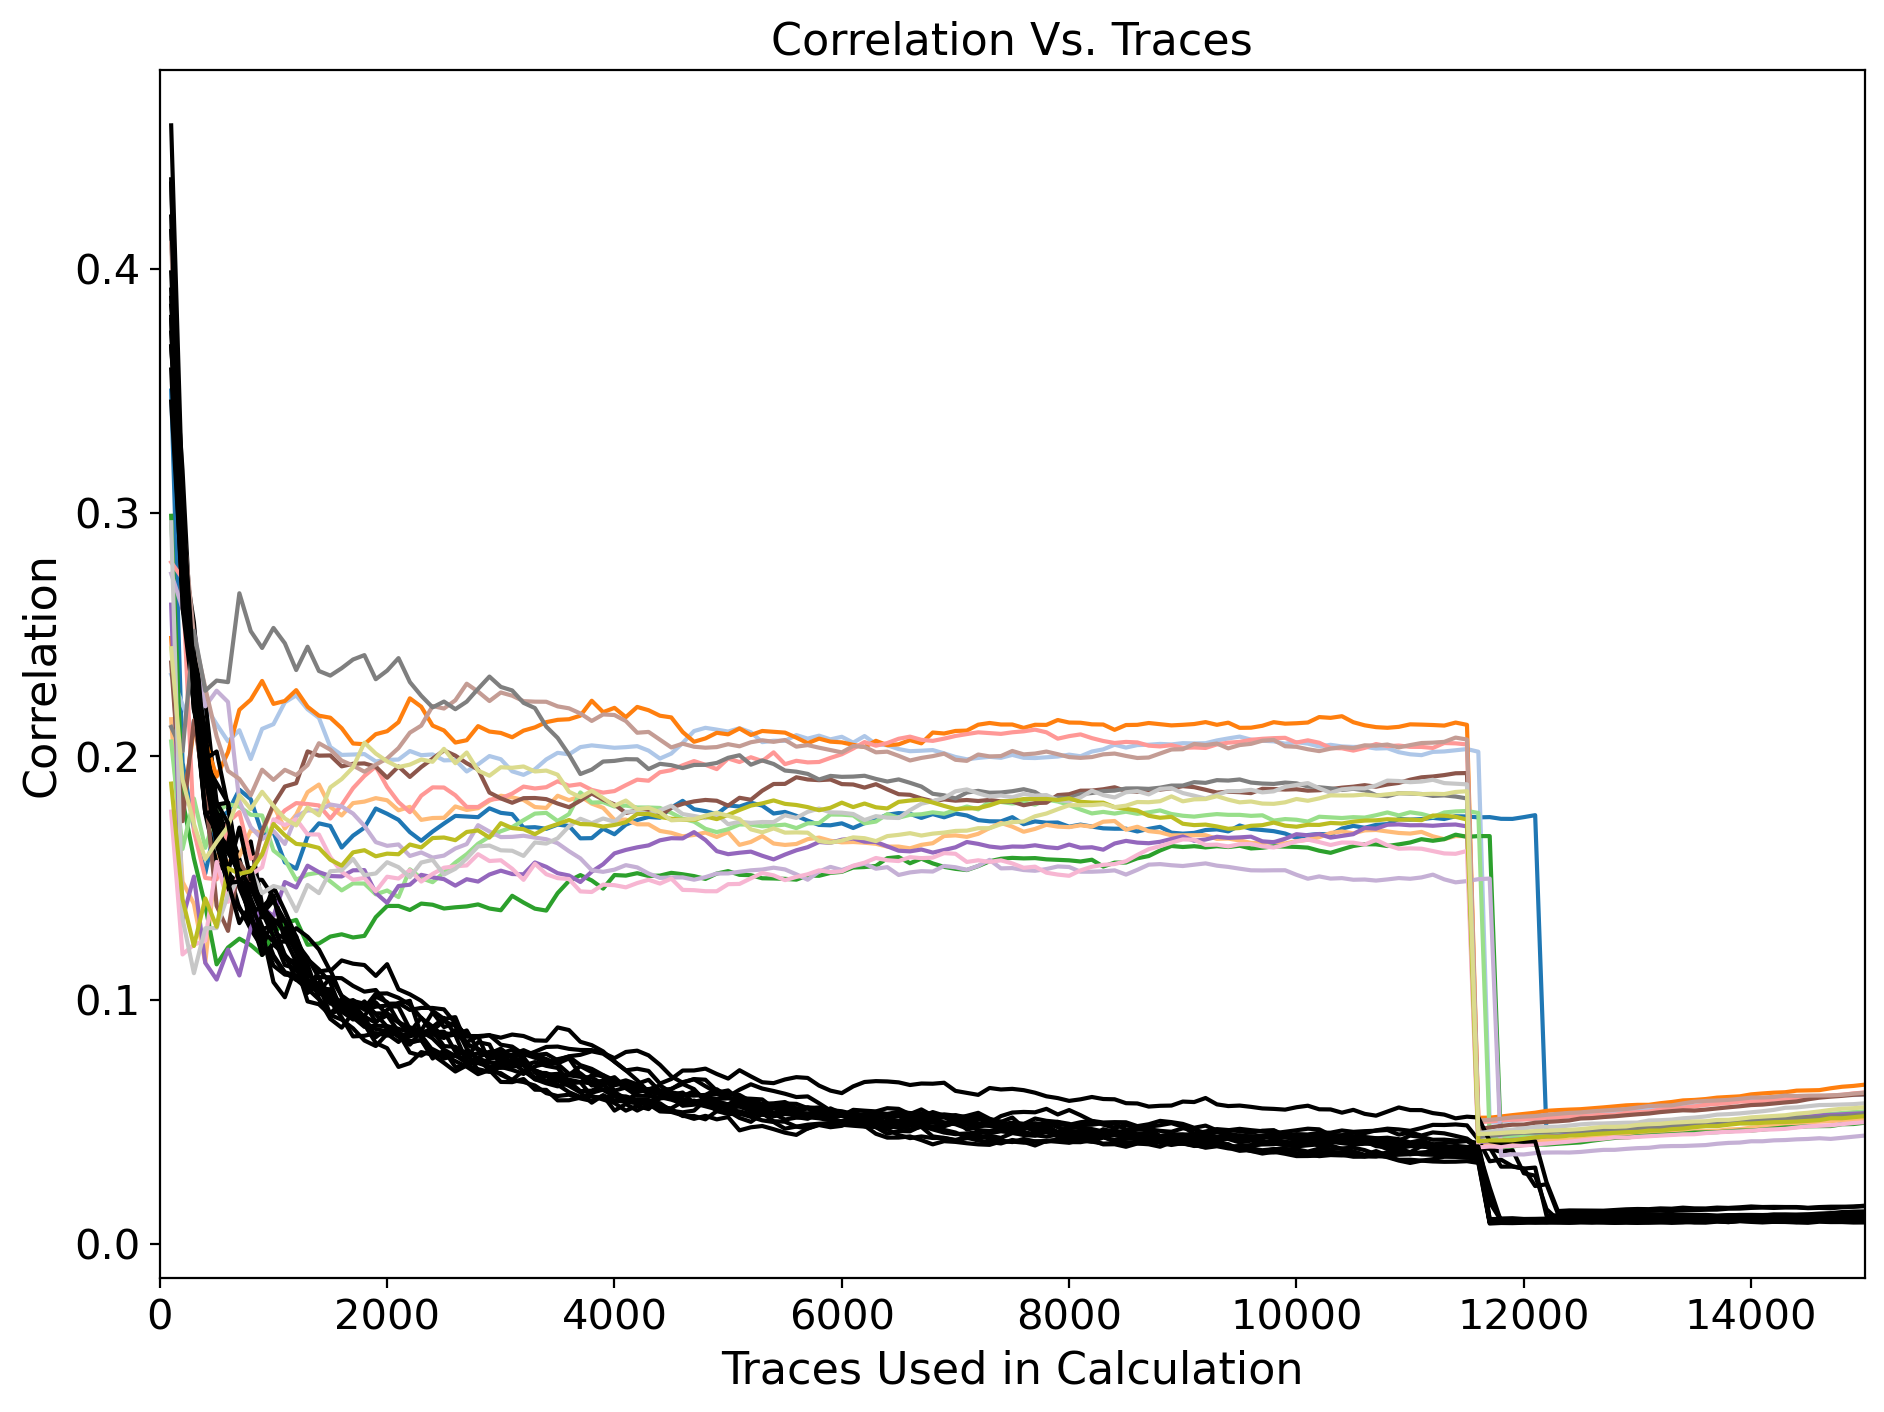
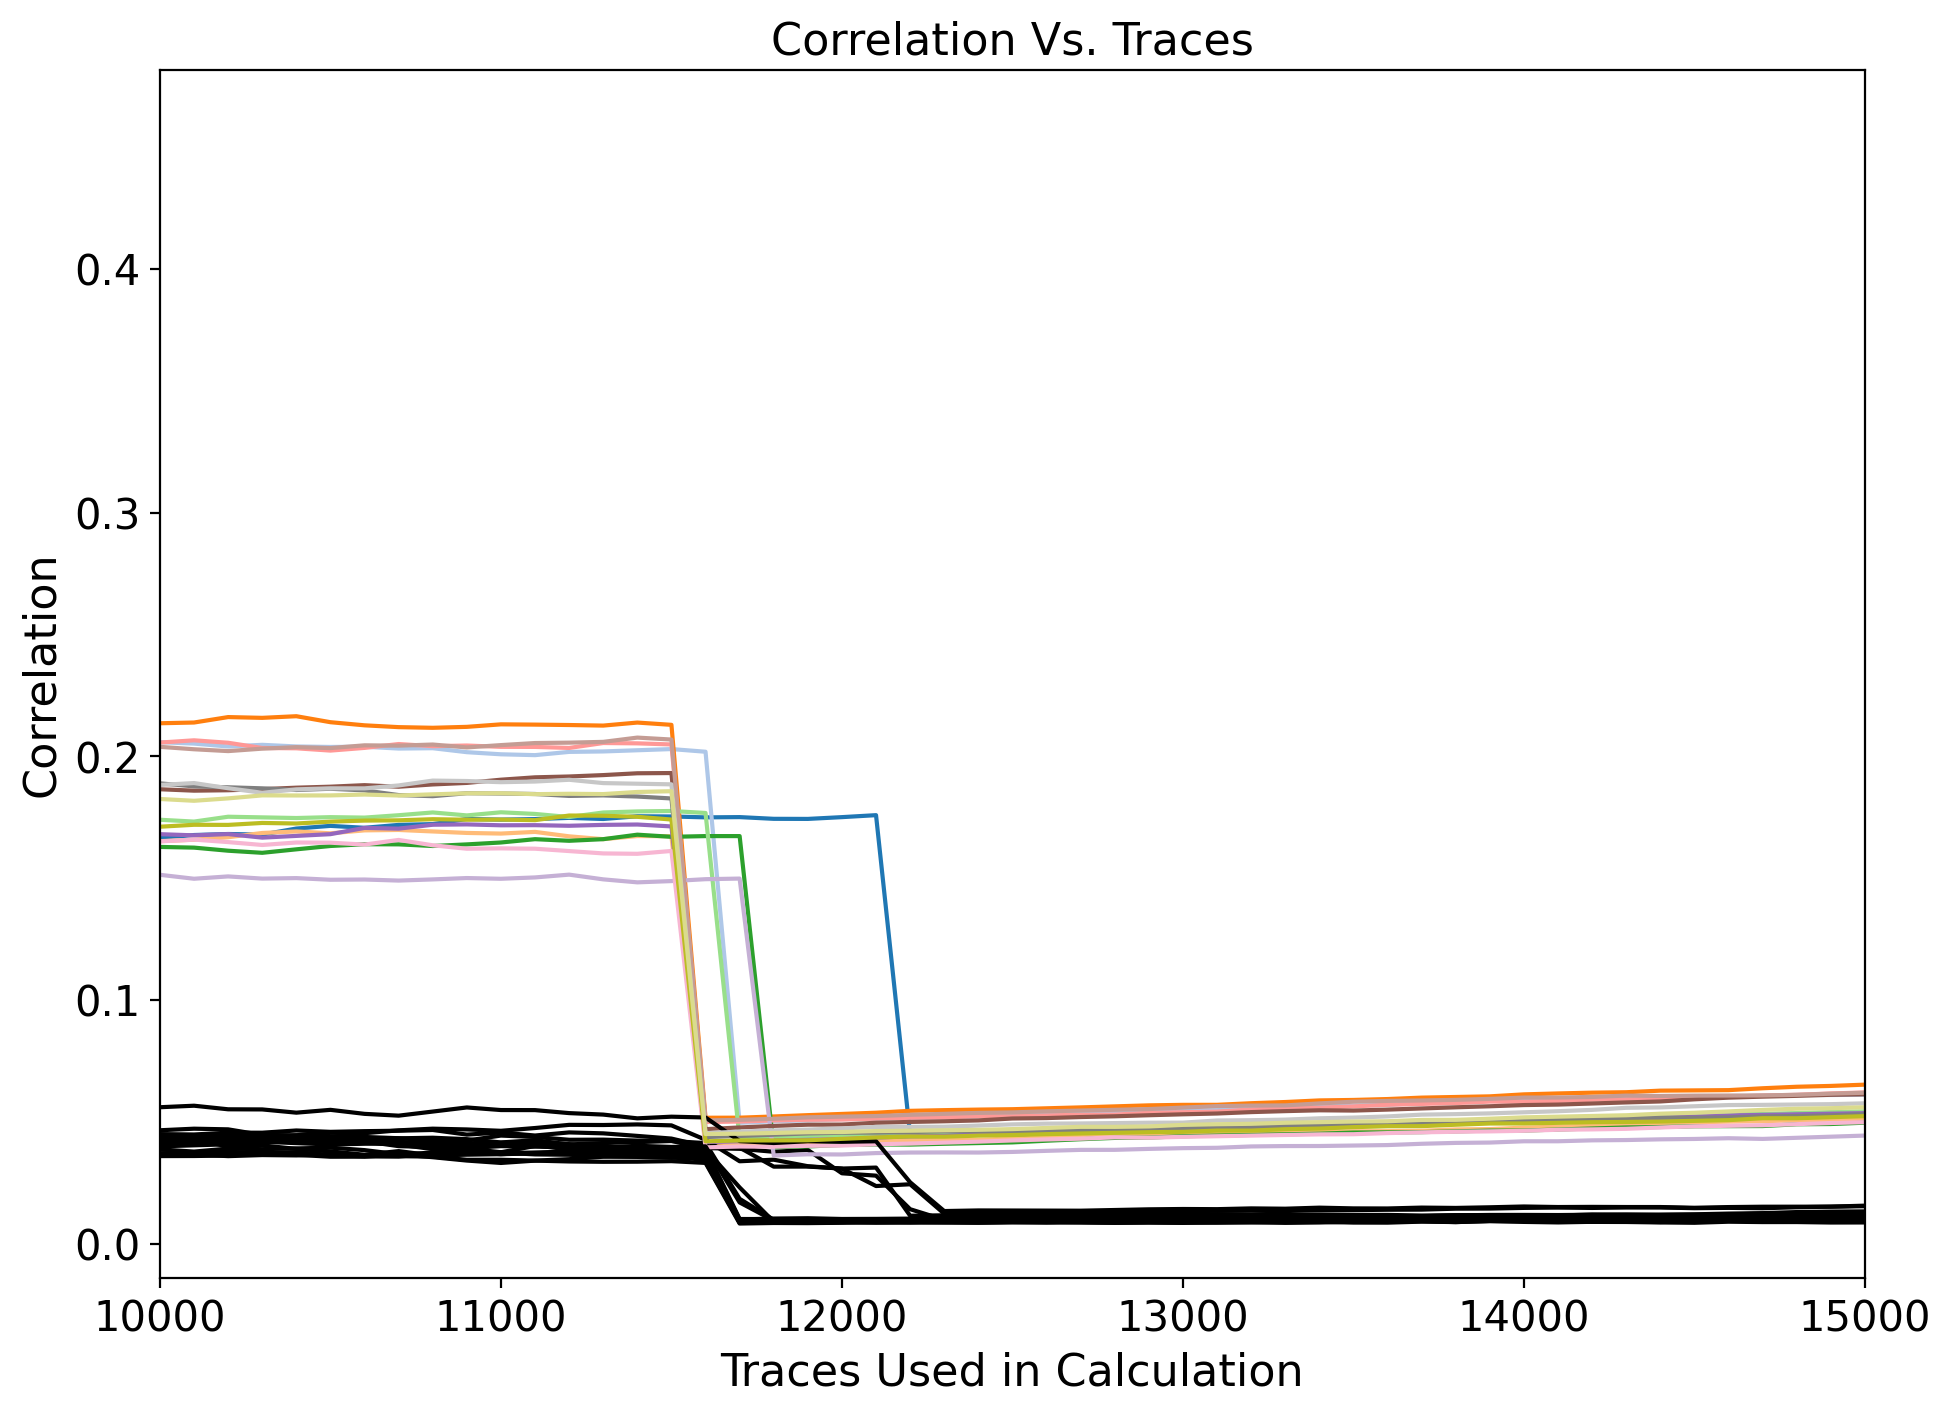
I’ve been having an issue with the correlation values found during a CPA attack. Recently, I’ve been experimenting with the attack size and I’ve found that when I use a large number of traces, there is always an abrupt drop in the correlation vs trace plot at roughly 11500 traces. Do you have any ideas why this is happening?
I’m using the Chipwhisperer-Pro to attack the CW305 Artix FPGA target. The CW305 has been using the default bitfile and some custom bitfiles. The attack is based on the CW305 AES demo and I have been using the last_round_state_diff leakage model. The plotting is based on Lab 4_3 of sca101.
I included an example plot below.
Thank you
Hi,
Have you tried plotting the traces around that point to make sure that they’re (at least visually) valid?
Alex
The drop is still present.
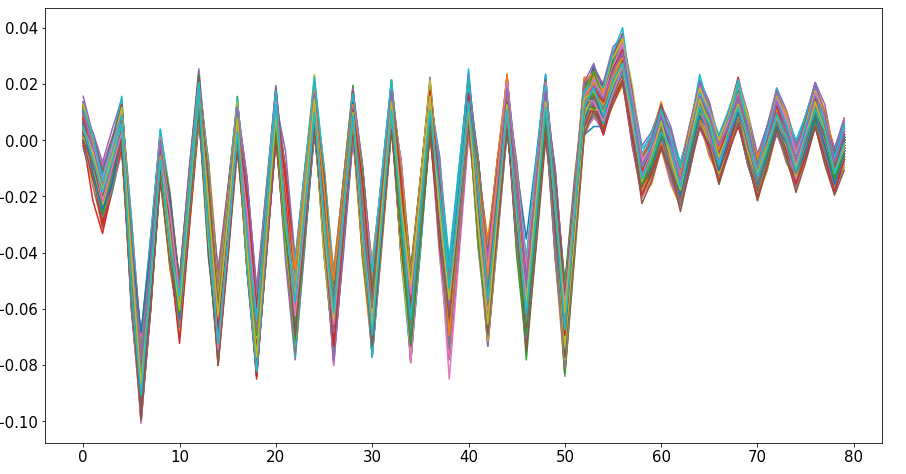
I’m talking about the power traces themselves. What do the ones around where you see the correlation drop look like?
The power traces at that point seem fine. I attached a plot of the power traces 11000 to 12000.
Also, this drop has occurred at the same point in multiple measurements.
In that case, I’m not sure why you’re seeing that drop in correlation. It’s possible there’s a bug somewhere in our analysis code that is causing this to happen.
I’d recommend using another analysis tool like LASCAR or SCARED if you’re going to be dealing with so many traces since those tools are orders of magnitude faster than our CPA analysis code.
Alex
Okay. I’ll look into them. Thank you.