Hi Alex,
Thanks for your investigation. I also did some testing, and here are my conclusions:
Attack result for 3k traces and point_range = [1000, 1500]
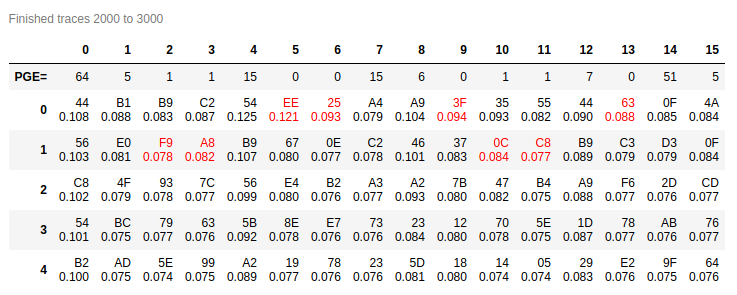
print([ np.argmax(plot_data.output_vs_time(i)[1]) for i in range(16) ])
[133, 319, 484, 82, 396, 84, 82, 82, 82, 141, 82, 300, 316, 327, 179, 290]
but (added np.abs, before np.argmax)
print([ np.argmax(np.abs(plot_data.output_vs_time(i)[1])) for i in range(16) ])
[393, 77, 77, 82, 77, 78, 77, 77, 77, 77, 77, 77, 77, 77, 78, 301]
With that in mind, same 3k traces, I tested point_range = [1077, 1078]
Attack results:
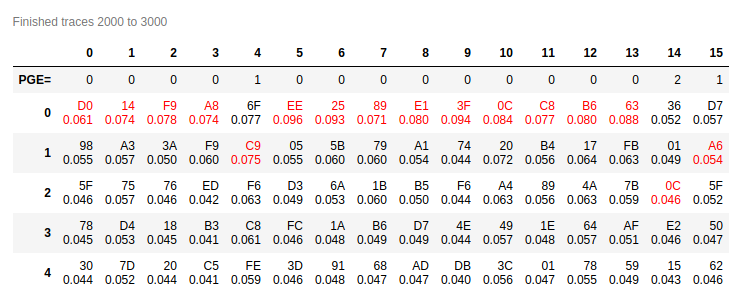
The green-red chart shows a huge spike downwards at sample 1077. So there is a correlation, but it’s negative and attack doesn’t follow it.
I don’t understand why, but a workaround is to force attack to only one point.