Dear all,
I was trying to align power consumption and instructions together so I synchronized the Scope and the target by *scope.clock.adc_src = ‘clkgen_x1’ and did the capture. Then I was confused by the following result:
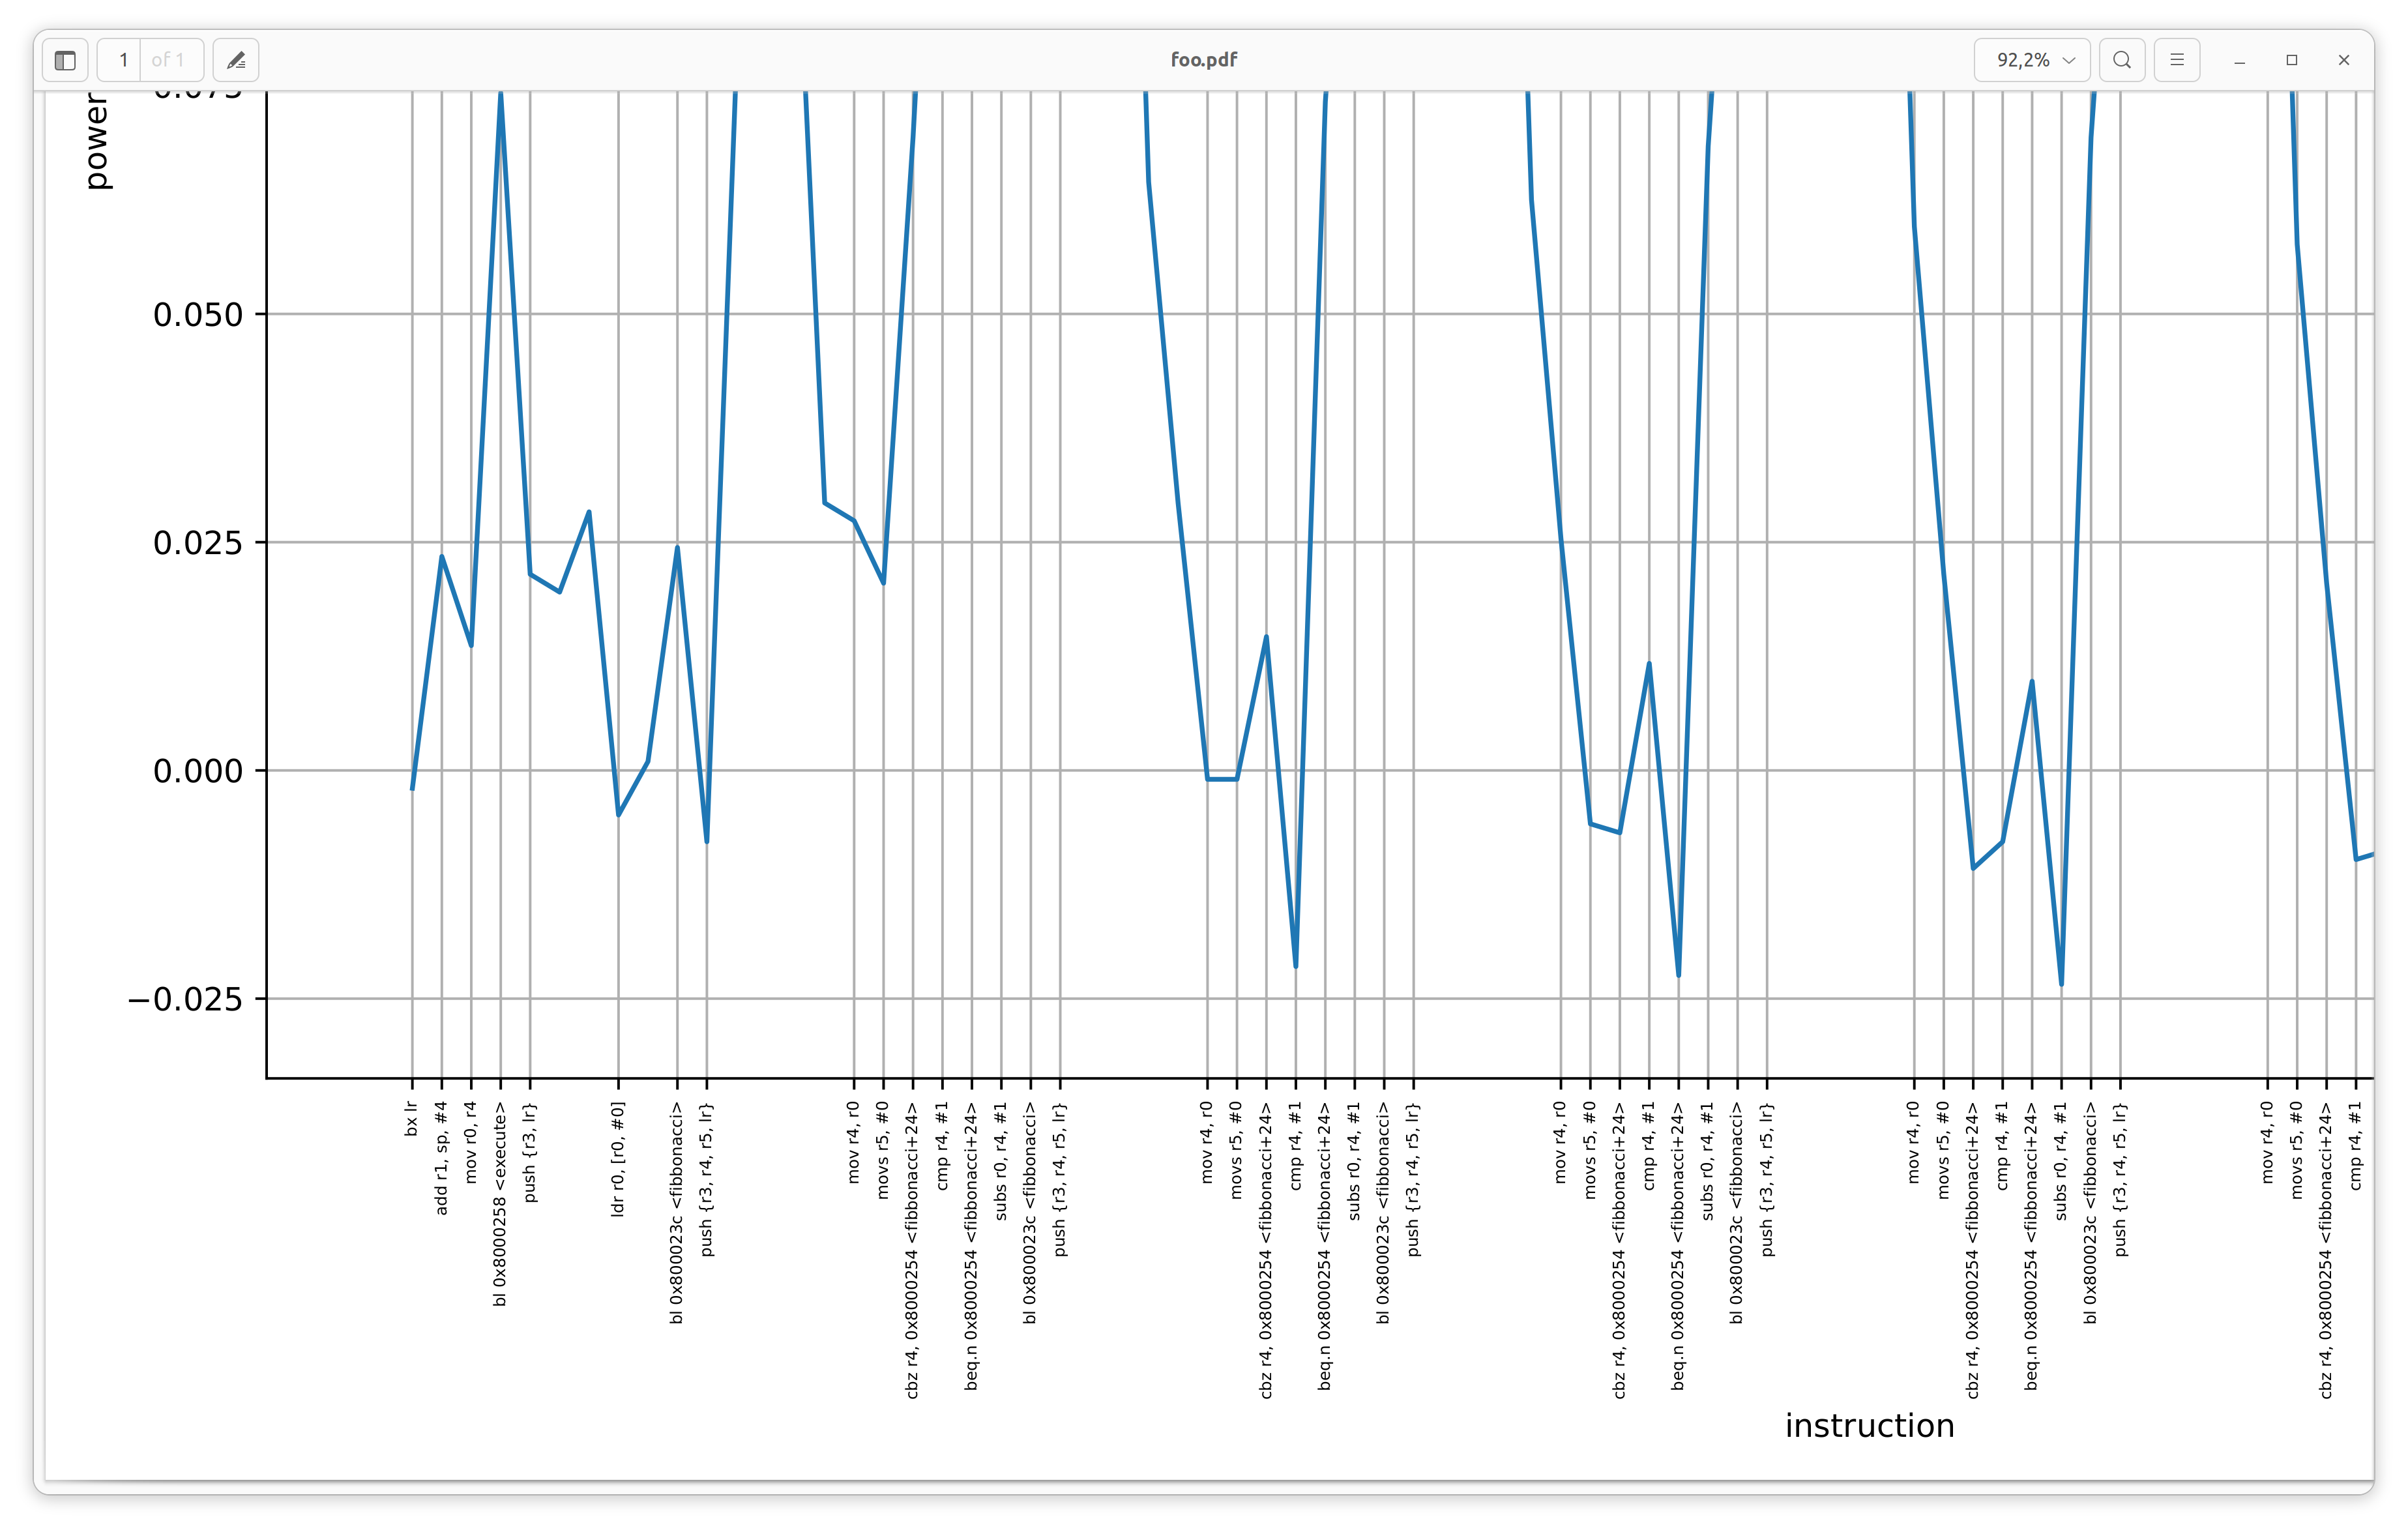
As the picture shows, there are 4 identical pieces: mov r4, r0 → push {r3, r4, r5, lr}
Every time when a piece is executed, the power trace “looks like” delayed by 1 more cycle. This phenomenon looks so abnormal to me. So here comes my questions:
- In the level of instruction, where does the scope exactly start the trace capturing? Is it triggered when “GPIOx->BSRR = (uint32_t)GPIO_Pin;” which is is str r1, [r0, #24] in assembly executed? In the plot, I assume the start of capturing is the instruction next to str r1, [r0, #24] which is bx lr.
- Are there any slightly clock difference between the target and the scope? How can I calibrate it if this is true?
Again, many thanks!
- The scope starts capturing when it sees the trigger pin high. It’s difficult to know exactly which operation is being executed at that time; even knowing which operation changes the GPIO state, how do you know the delay between that operation being executed and the actual GPIO state change? Perhaps you can find the answer by deep diving into ARM and STM32 documentation. For side-channel attacks this isn’t usually something that’s needed.
- If you’re sampling synchronously (e.g. target is clocked from HS2), no. The same clock drives the target and the ChipWhisperer ADC sampling.
With respect to your observation that things appear to shift one cycle at each execution, it looks like you’re assuming that each instruction takes one clock cycle, but this is not necessarily true:
https://developer.arm.com/documentation/ddi0439/b/Programmers-Model/Instruction-set-summary/Cortex-M4-instructions?lang=en
If any instruction is taking two cycles, that would explain what you’re seeing.
Finally, what you may find helpful is to compare power traces for two executions: one which has some instructions you’re interested in profiling, the other where those instructions have been replaced by a long sequence of NOPs. The NOPs will usually have a very different power signature, and so by plotting the two power traces together, you can infer which instruction is on which clock cycle.
I hope this helps,
Jean-Pierre
Hi, thanks for answering.
I have already known that different instruction take different clock cycles to execute. Therefore, the clock cycles I got are from the CYCCNT of DWT register. If you see the x-axis in figure clearly, some instructions take longer and some take shorter.
Based on your 1st answer, so the scope and the target are not 100% synchronized?
No: as I said in (2), if your target is clocked by the HS2 pin, then the exact same clock is driving both your target and the CW ADC sampling circuit. This synchronous sampling is a core principle of the ChipWhisperer system.
How is your target connected to ChipWhisperer? Where does its clock come from?
Hi, I have a ST-LINK V2 debugger connected to my CWLite. Then I enabled DWT and used GDB stepi to record every instruction. Before an instruction was executed, PC and CYCCNT were recorded though GDB. That’s how I have the instructions and the corresponding clock cycles.
Hi, after checking the manual, I found out there is speculative branch happening in the target. Therefore, it makes the execution time of branches incremented. When GDB is running, all the branch instructions take 1 cycle. Without GDB, the branch takes 2 cycles.
Now the question is: how to disable such speculative branch in cortex m4.
Makes sense! Thanks for confirming.