I saw the feature in CWAnalyzer Tool, while you were collecting the traces, one could see all the frequencies plotted in real time during the computation. This would be really helpful for me to understand why my approach is not working.
Is there a way to use CWAnalyzer Tool, even when it is outdated? If not, is there another tool in the CWAnalyzer library that makes it possible to plot traces in real time? I know the holoviews library exists, but I am not sure how to use it here.
If you’re looking to just plot the traces as you capture them, then that’s definitely possible. If you go to the capture section of courses/sca101/Lab 5_1 - ChipWhisperer CPA Attacks in Practice.ipynb, it shows an example of this. Basically, you run
%run "../../Helper_Scripts/plot.ipynb"
plot = real_time_plot(plot_len=<length_to_plot>)
Then you can update the plot with a new trace via plot.send(trace).
It’s pretty slow, so it’s best if you don’t send every trace. In that notebook, for example, we send every 10th trace.
Alex
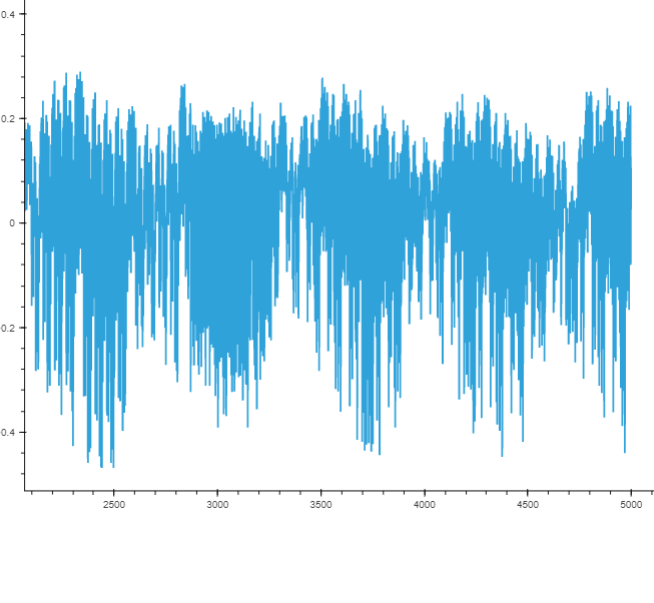
thanks, although is it possible for the graph to be more precise? I see its a little bit swollen, I cant see the peaks with constant operations. I Tried to run the 5_1 lab with lascar but get few errors, is the code for this up to date?
import chipwhisperer.common.api.lascar as cw_lascar
from lascar import *
cw_container = cw_lascar.CWContainer(project, project.textins)
cpa_engines = [CpaEngine(“cpa_%02d” % i, cw_lascar.sbox_HW_gen(i, range(256)) for i in range(16))]
session = Session(cw_container, engines=cpa_engines).run(batch_size=50)
Do you see the trace being cut off? If so, you probably need to turn the scope gain down.
What sort of errors are you getting from the LASCAR code?
Alex
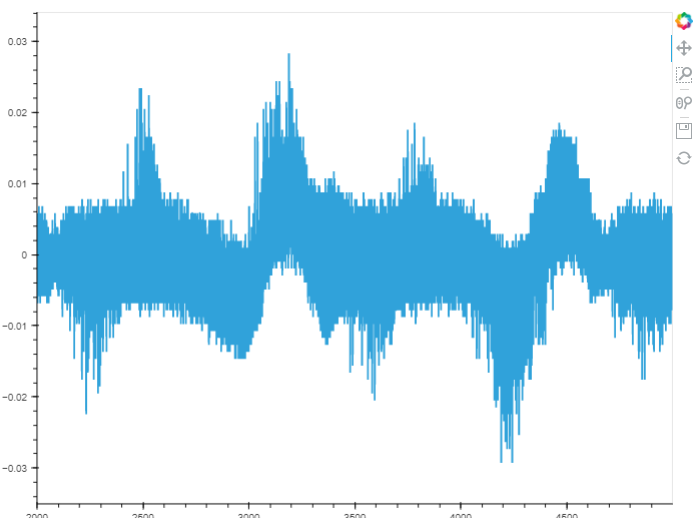
I am working with the EM Probe. Using Power Analysis, I get the solution. When I plug the SMA cable to the probe, I get different look of the traces and cant get a solution. I tried to reproduce the attack from the youtube video about HField Probe, although even when I use almost the same spot as in the video, I get no solution.
What I tried to do is to redo the attack from the video. Colin searches for constant peaks/operations in the waves, which imply the right position for the attack. How do I find the right position, when the plot is not that accurate and I cant see the peaks with my eyes?
When I run the lascar code
import chipwhisperer.common.api.lascar as cw_lascar
from lascar import *
cw_container = cw_lascar.CWContainer(project, project.textins)
cpa_engines = [CpaEngine(“cpa_%02d” % i, cw_lascar.sbox_HW_gen(i, range(256)) for i in range(16))]
session = Session(cw_container, engines=cpa_engines).run(batch_size=50)
I get error:
File “”, line 4
cpa_engines = [CpaEngine(“cpa_%02d” % i, cw_lascar.sbox_HW_gen(i, range(256)) for i in range(16))]
^
SyntaxError: Generator expression must be parenthesized
Try increasing the gain of the adc scope.adc.db. It’s likely that Colin used an additional 20dB LNA in that video.
Alex
I already did increase it to 55db, I am also using the LNA with the scope. I did every step shown in the video, although I use jupyter and not the CWAnalyzer software, still, my traces dont look that accurate and I cant find the peaks with my own eyes, like in the video. How do I achieve that?
I’m not too sure what the issue is then. Everything that goes into generating those traces should work the same, but yours are clearly different. To make sure, are you using the Xmega target board like in the video? Also, can you try without the 20dB LNA, just to make sure that’s not the issue?
Alex
I think there’s something wrong with your trigger or ADC clock, as the traces should line up pretty cleanly even without a resync. Are you using the normal settings with simpelserial-aes?
Alex
If the trigger or ADC clock wouldnt work, would the standard power analysis attack work (connecting SMA to board)? Im using the standard settings from tutorial 5_1, didnt change anything. Just wanted to replay the attack from the video to see how the EM probe is working, although having problems with that…
I don’t think it would, but it’s possible. Can you post a trace you get with the normal measurement setup? Also, can you post print(scope) just before you try capturing with the H-Field probe?
Alex
Are you holding the EM probe manually? Is it moving at all during measurements? If it is, that’s why your traces appear to move around. The probe needs to be totally immobile.
The probe is not moving and is in constant position