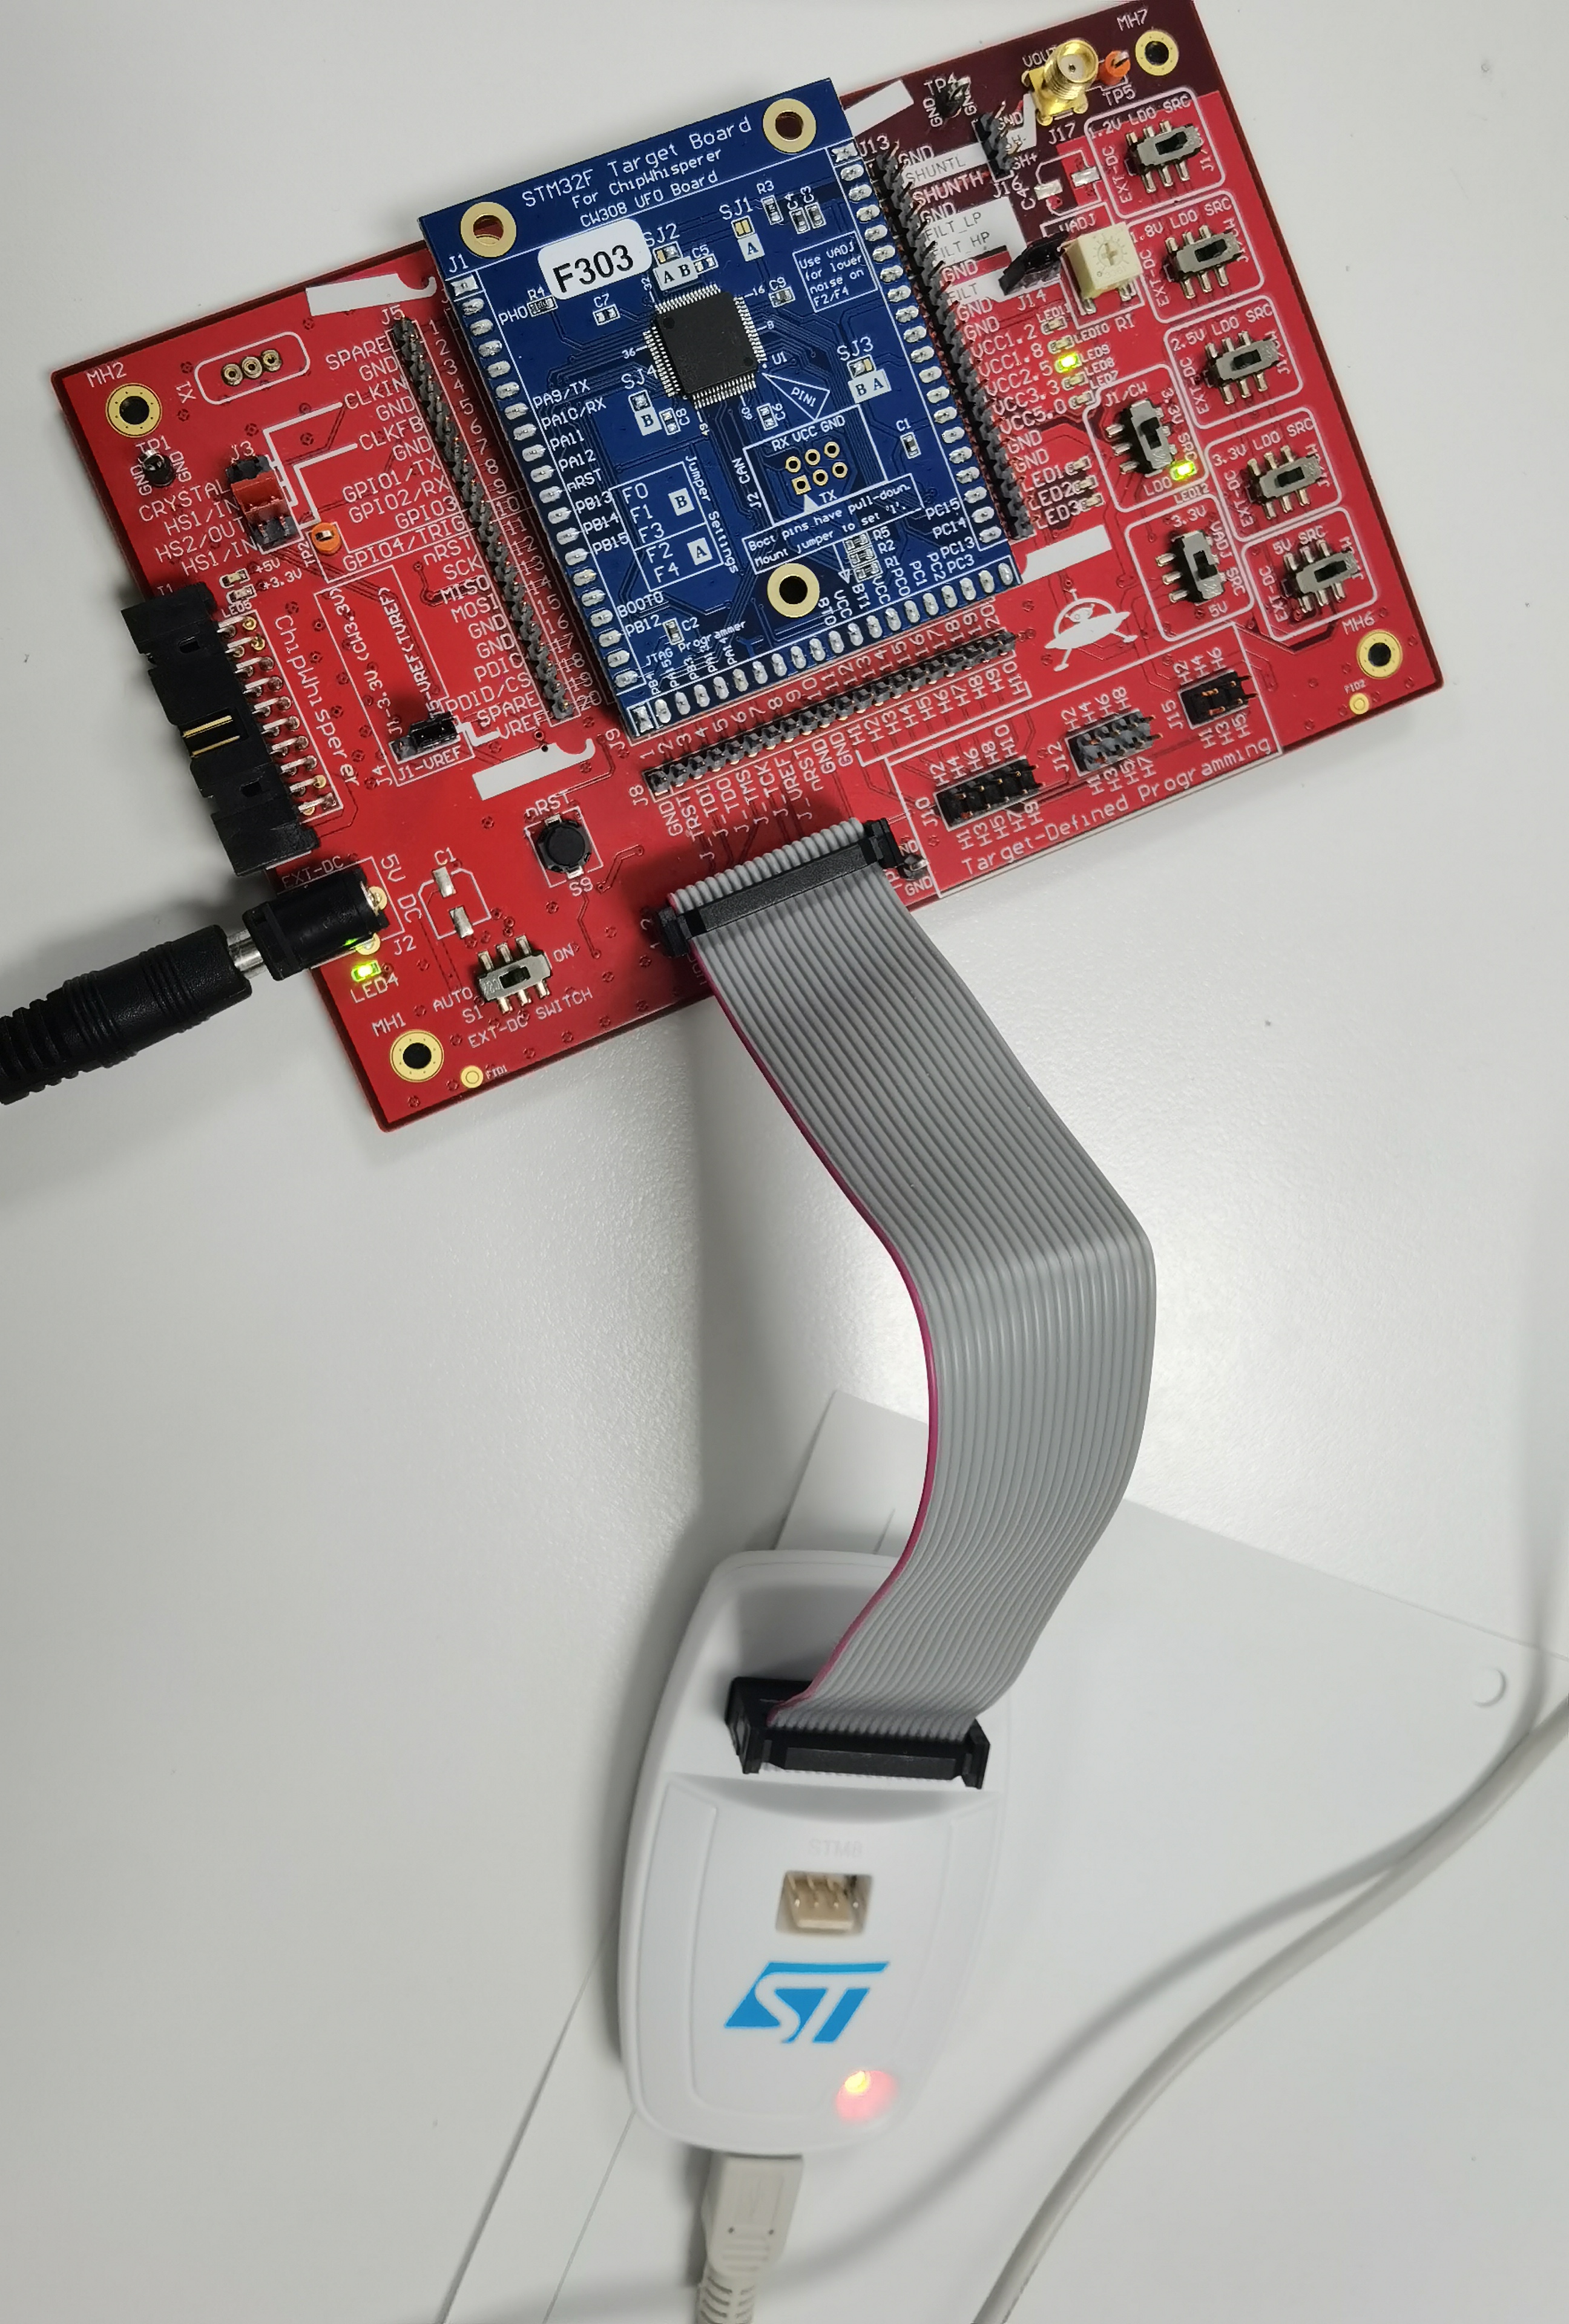
I am using CW-Lite and STM32F3 for capturing a long trace. I use offset in the code but meet with some problems.
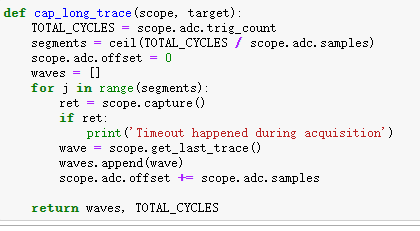
When I use scope.adc.trig_count to test the length of trigger_high, I always get different value in different executions. I look into the course of CW305 and find using a code like:
There is a hardware issue (https://github.com/newaetech/chipwhisperer/issues/351) where scope.adc.trig_count does not always get reset to zero before each capture; the workaround is to do what you found in the CW305 demo.
You need to arm the scope and send your “go” command before every scope.capture() call in your segments loop.
Thanks for your quick reply!
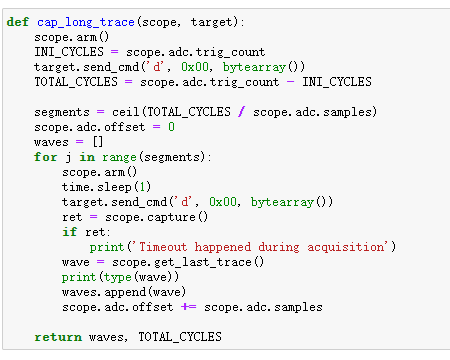
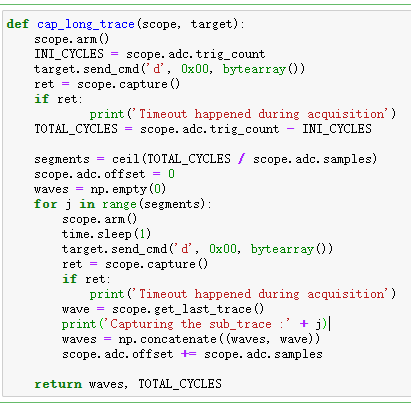
I understand what’s the meaning and I change my code as:
But it still give me different counts of trigger_high() and it is strange that the function which ‘d’ calls is a very long function that it ought to have more than the trigger counts. That’s odd. I don’t know whether I counts the trigger right.
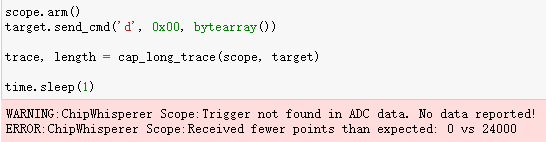
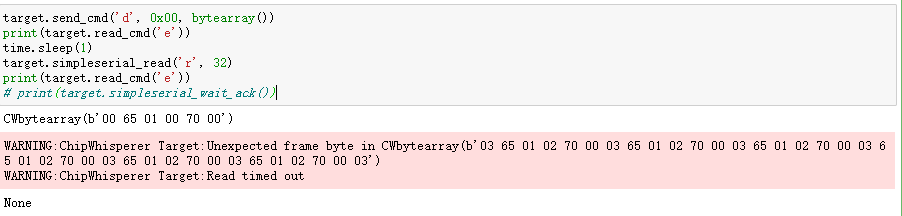
What’s more, when I tried using simpleserial_put('r', 32, m) in firmware and target.simpleserial_read('r', 32) in python, I encountered an error like:
Regarding your 1st issue: when you assign TOTAL_CYCLES, you may be reading scope.adc.trig_countbefore the target operation has finished. You need to add ret = scope.capture() before you read scope.adc.trig_count. You should then find consistent times.
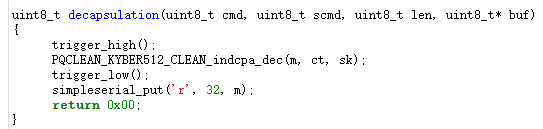
For your 2nd issue: since I can’t see all your code it’s hard to determine the problem. Are you sure that in the firmware, the ‘d’ command calls your decapsulation() function? What’s the purpose of target.read_cmd('e')?
I follow your advice of adding ret = scope.capture() before you read scope.adc.trig_count like:
It can reading the sub-trace now but still return a unstable value of counts.
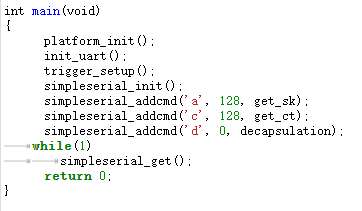
And for the second one, I think ‘d’ command calls my decapsulation() here because the ‘a’ and ‘c’ command work well.
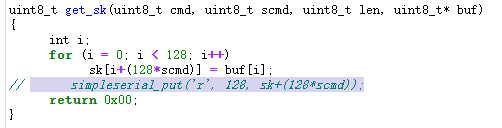
I find a really strange situation that if I add simpleserial_put('r', 128) in my get_sk and get_ct function, the decapsulation() function work well and can read the m[32] out. But if I only add simpleserial_put('r', 32) in my decapsulation() function, it returns the Unexpected frame byte error like I mentioned before.
P.S: ‘a’ command used for passing the ciphertext to target and ‘c’ for secret key.
Are you sure that the trigger is always high for the same number of clock cycles? Can you verify that with a logic analyzer or oscilloscope?
Jean-Pierre
Do you mean using an oscilloscope with pin TRIGOUT on CW-Lite? I find the counts of trigger is unstable but with small error and it is ok with my capturing for now, but I really want to fix this problem .
What’s more, is target_flush() necessary during a capture loop? When I used target_flush() at the end of my capturing loop, it can work well. But as long as I commment this code, it will return an error.
Yes, measure the trigger pin with an oscilloscope; maybe you will find that the target operation does not run in constant time.
target_flush should not be necessary; this suggests that your target is sending more data than you are reading. Looking at the actual UART traffic on the IO1/IO2 pins might give some clue, e.g. maybe your target is sending a different response than what you expect.
Thank you very much. I will try these suggestions.
BTW, is there any platform that I can used for debugging? It is not really convenient for using Chipwhisperer 5.6 if I meet with errors while running the program.
What’s more, I tried using ST-LINK v2 for programming but the PC cannot recognize my 308 board but only have ST-LINK shown.
But I just tried connecting the CW-Lite as well and found it working. So even if I used the ST-Link for debugging or programming, the CW-Lite is always necessary, right?
What’s more, is there any platform I can use for debugging (like keil or else), so that I can find out what’s wrong during my communication between PC and target.
And I used System Workbench for STM32 for debugging and I am thinking that this software cannot simulate the procedure like we doing in Jupyter and can only test the firmware, right? If I want to find out what’s wrong during my communication, what should I do ?
The usual way to debug is to attach the debugger to the program that’s running on the STM32. Then, from Jupyter you would provide stimulus to the STM32, and the debugger allows you to observe what happens.
You can use any software debug platform you like as long as it supports your ST-link.
To my understanding, I can run the Jupyter and my debug software at the same time? The command sent via Jupyter and the software can tell what happens?
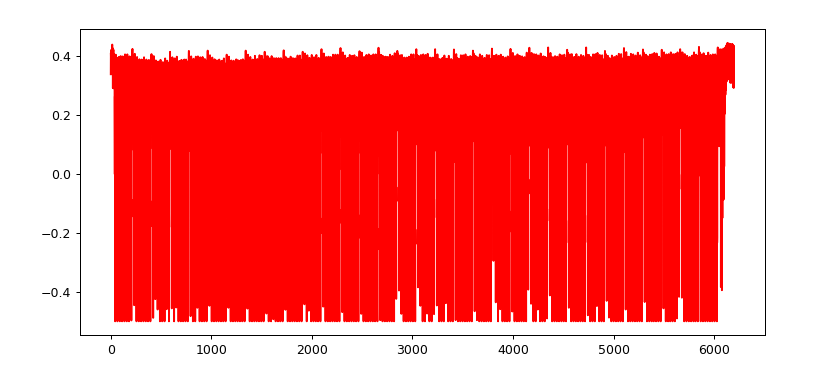
That’s because scope.get_last_trace() converts the 10-bit sample values to floating point in the range [-0.5, +0.5]. +/- 0.5 means the ADC has saturated.
If you prefer, you can get the raw 10-bit ADC samples with scope.get_last_trace(as_int=True).
Jean-Pierre