I am working with a ChipWhisperer Husky and a CW305-100T FPGA target board. For testing, I am using the standard AES example and attempting to capture long traces (250k samples total) following the method described in the: How to capture more samples than the hardware supports? — ChipWhisperer Documentation
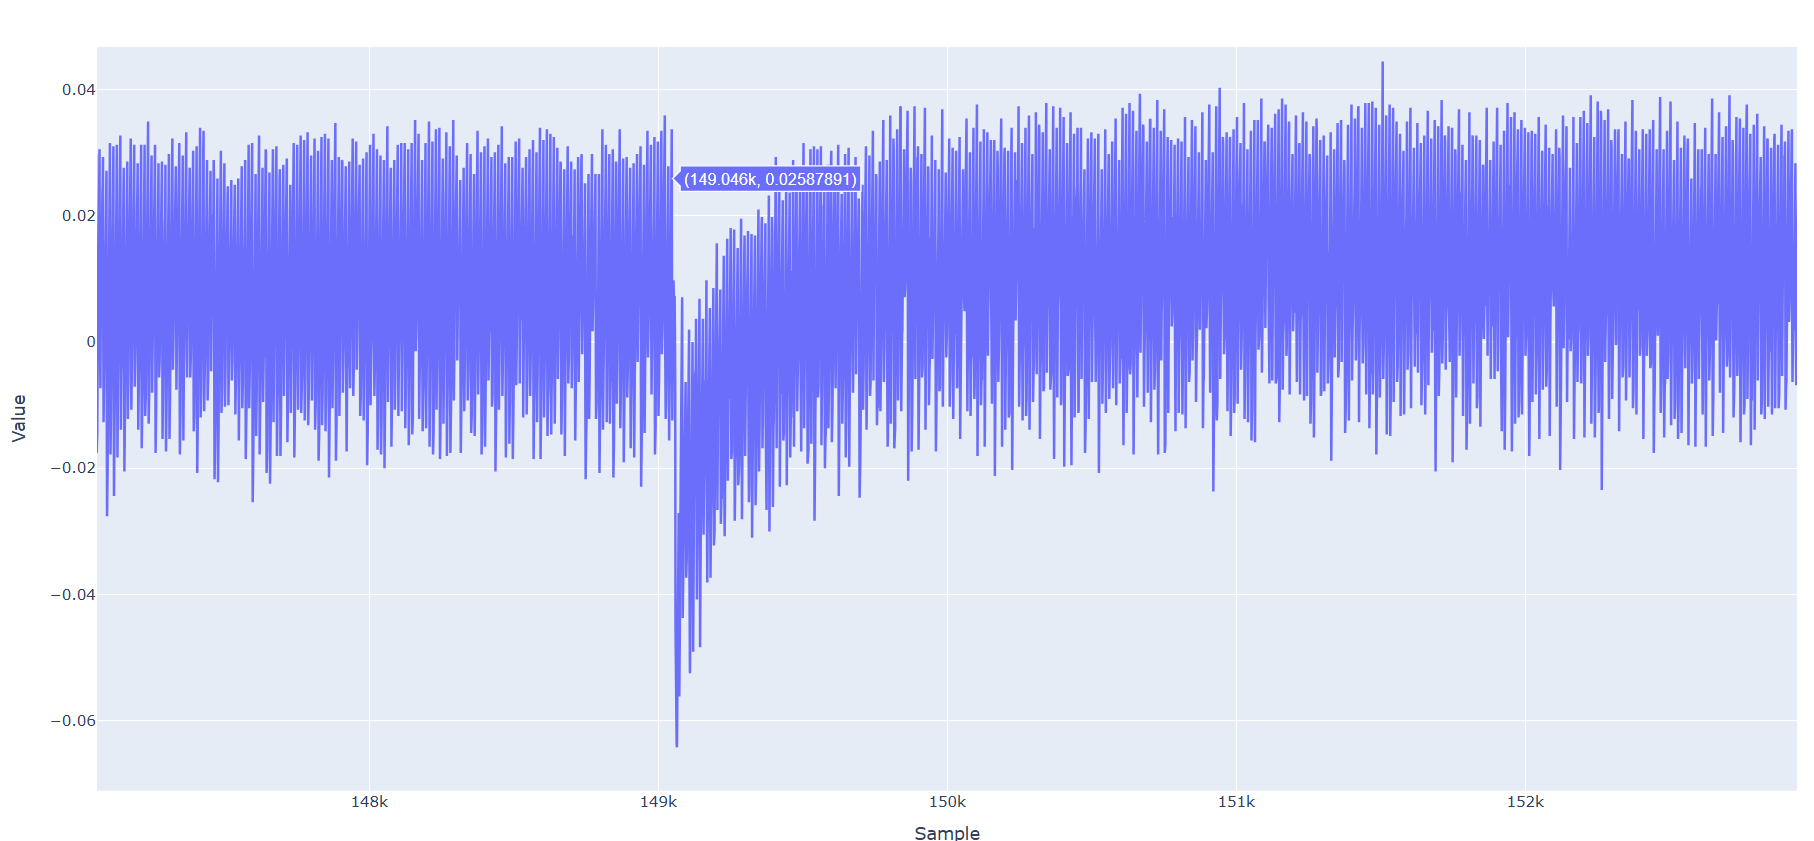
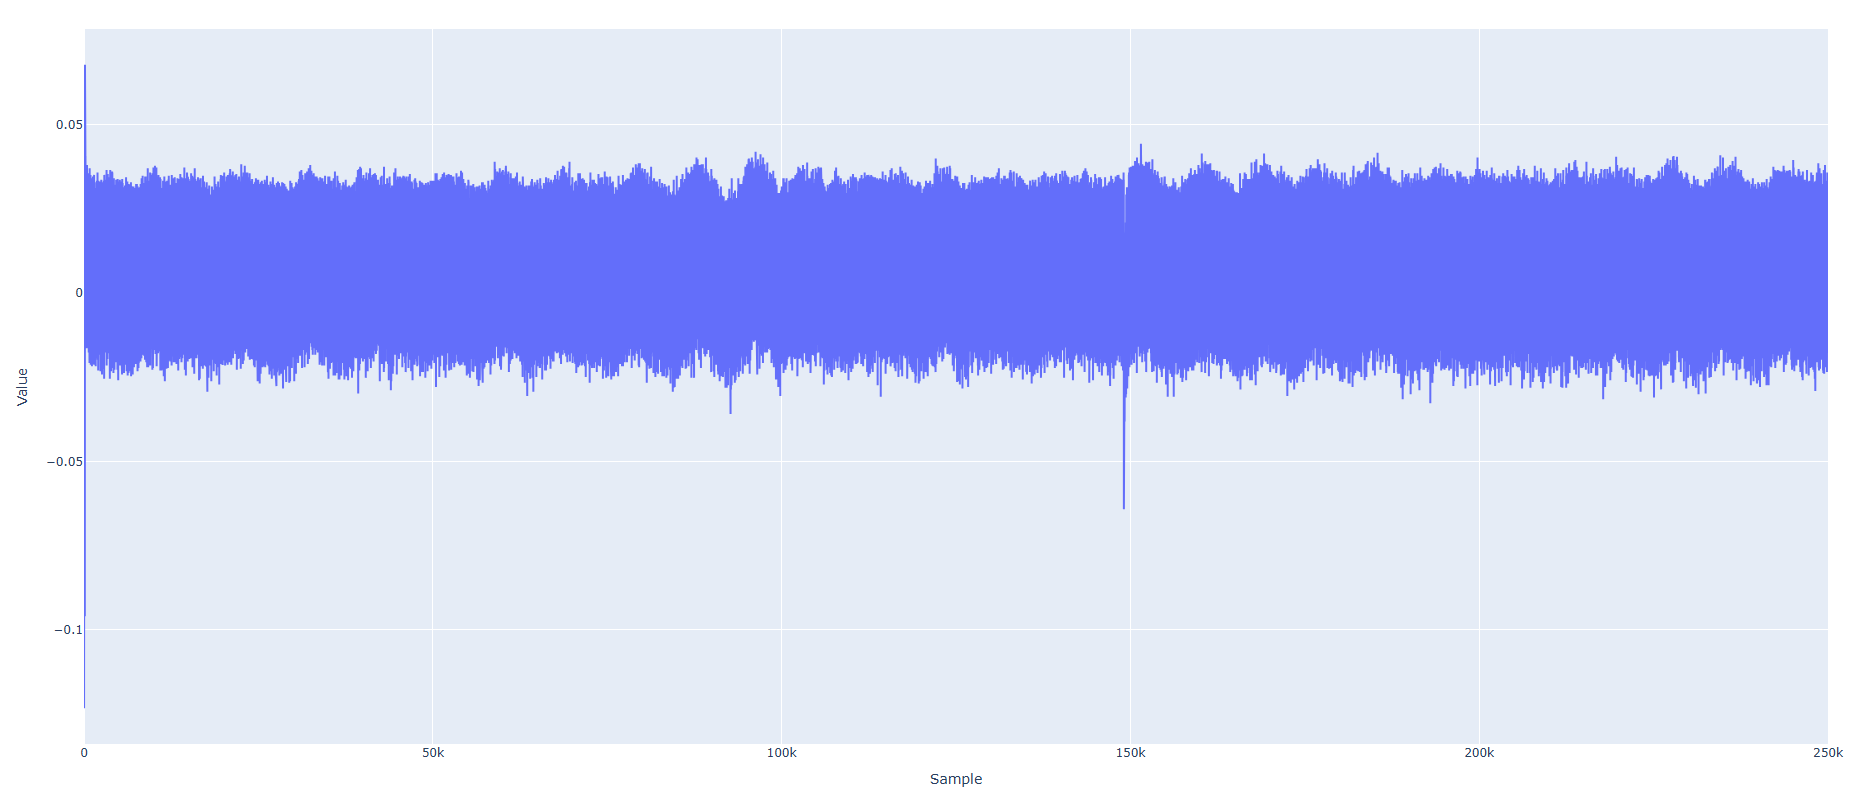
Specifically, I acquire 100k samples per iteration and concatenate the traces. However, after approximately 130k samples, I consistently observe a significant negative spike (drop) in the signal. The exact location of this drop varies randomly within a range of roughly ±20k samples.
This behavior is illustrated in the attached figure.
When I run my own custom implementation instead of the AES example, the drop becomes even more pronounced
The errors desplaied by scope.errors are
sam_errors = False
sam_led_setting = Default
XADC errors = False
ADC errors = gain too low error,
extclk error = False
trace errors = False
The “gain too low” warning may be expected, as most of the captured trace corresponds to idle state, while the AES operation itself spans only ~100 samples. For my own implementation which takes more than 250k samples to finish the error does not occure.
Here are my settings:
scope.default_setup()
scope.adc.bits_per_sample = 12
scope.adc.offset = 0
scope.adc.basic_mode = “rising_edge”
scope.adc.samples = Samples
scope.clock.clkgen_freq = 10e6
scope.clock.clkgen_src = “extclk”
scope.clock.adc_mul = 12
target.vccint_set(1.0)
target.pll.pll_enable_set(True)
target.pll.pll_outenable_set(False, 0)
target.pll.pll_outenable_set(True, 1)
target.pll.pll_outenable_set(False, 2)
What could be causing this large negative spike in the trace when capturing extended sample windows? Is this related to the segmented capture method, clocking, or ADC behavior? Additionally, what steps can be taken to eliminate or stabilize this artifact?